*** START OF THE PROJECT GUTENBERG EBOOK 75914 ***
Transcriber’s Note:
New original cover art included with this eBook is granted to the public domain.
Proceedings of the American Academy of Arts and Sciences.
Vol. 61. No. 10—July, 1926.
ON THE DISTRIBUTION OF INTENSITY IN STELLAR ABSORPTION LINES
By Cecilia H. Payne and Harlow Shapley
459
ON THE DISTRIBUTION OF INTENSITY IN STELLAR ABSORPTION LINES[1]
By Cecilia H. Payne[2] and Harlow Shapley
1. It is unnecessary to emphasize the significance of the form of
absorption lines in the study of problems of atomic structure and the
physical constitution of stellar atmospheres. There has been an
abundance of theoretical work on line contour, but a remarkable
scarcity of quantitative observation. The present preliminary study
is aimed to meet, in part, the need for measurements on the broad and
strong lines in the spectra of stars of various types.
In general the investigation has been based on objective prism
spectra, analyzed with a photographically recording microphotometer.
The ease with which a photometric scale can be set up on these plates,
available throughout the whole length of the spectrum, and essentially
independent of the variability of plates and development, is a decided
factor in favor of using objective prism spectra. Other advantages
include the efficiency of the objective prism spectrograph and its
simple operation. The possible disadvantage of lack of purity is not
important, at least in the case of the lines discussed in this communication;
the extent to which scattered light affects the true contours
of the absorption lines is considered below.
That the results from slit spectrographs are in essential agreement
with these slitless spectrograms is shown in Figure 1, where microphotometer
tracings of spectra from the two sources are shown.
Through the courtesy of Professor W. J. Hussey and Professor R. H.
Curtiss, of Ann Arbor, some excellent spectrograms made with the
single prism spectroscope at the Detroit Observatory have been sent
to Harvard for this comparison. The dispersion is practically the
same on the Michigan and Harvard plates. The microphotometer
records were made under identical conditions for the two sets of
spectra, though the presence of comparison lines on the Michigan
plates and the narrowness of the spectra made their analysis more
difficult.
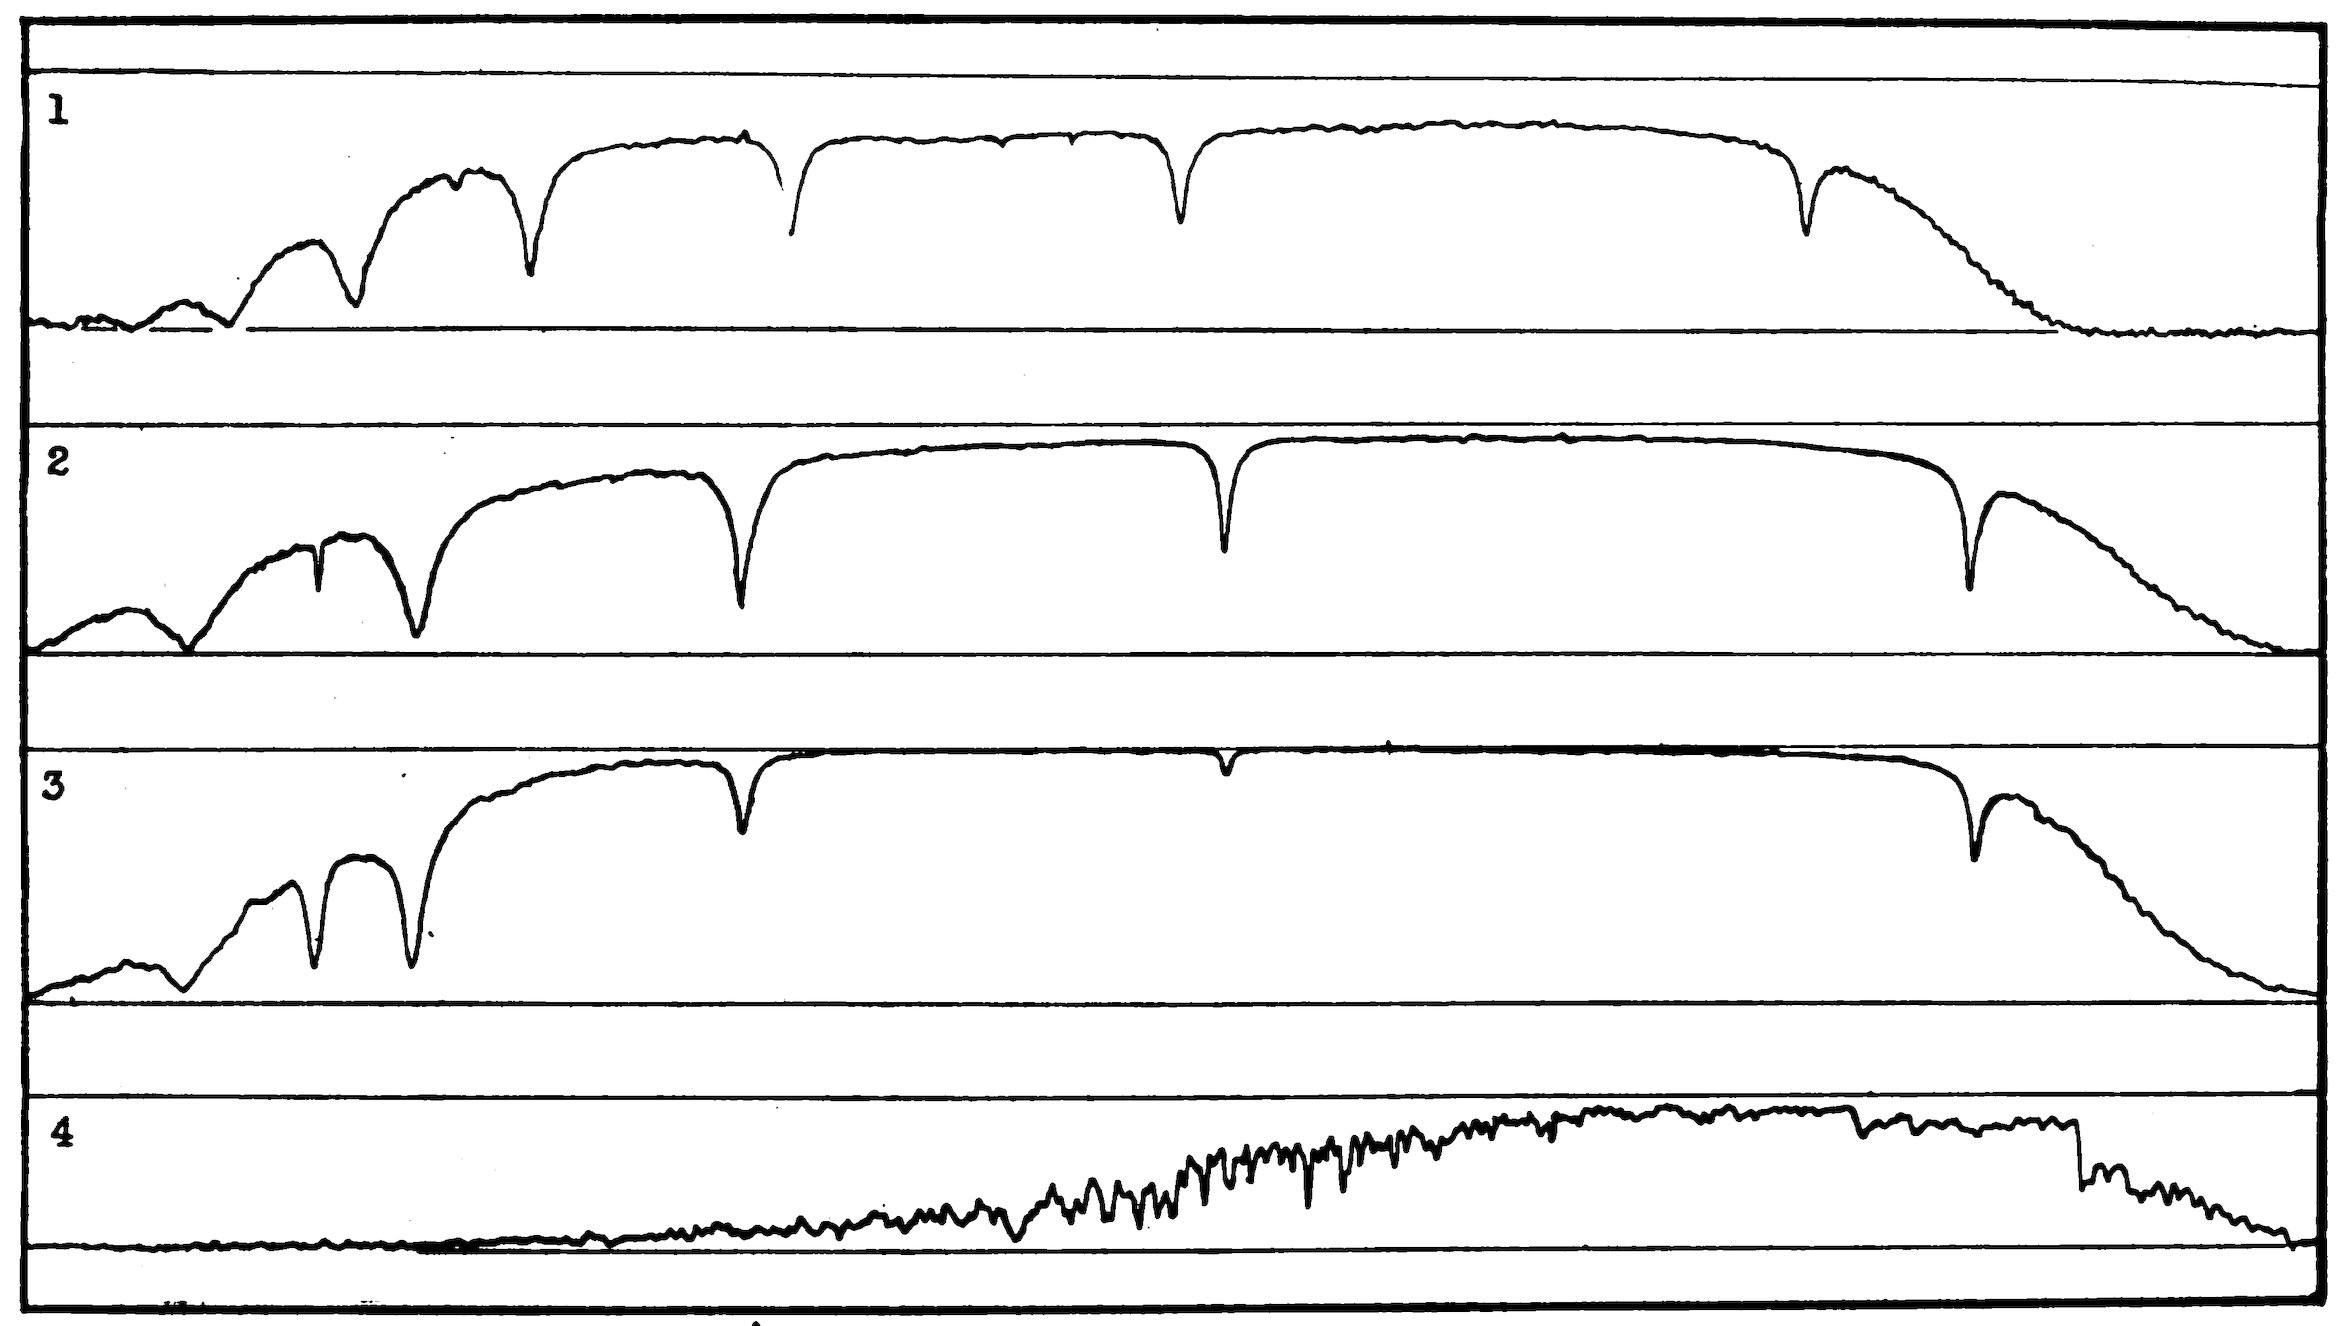
Figure 1.—Microphotometer tracings made from the spectra of four stars. The names of the stars, and the sources of the analyzed spectra, are as follows: (1) α Canis Majoris (Sirius), Harvard objective prism spectrum, (2) α Lyrae (Vega), slit spectrogram, Detroit Observatory, (3) α Aquilae, slit spectrogram, Detroit Observatory, (4) β Pegasi, slit spectrogram, Detroit Observatory. The violet ends of the spectra are to the left.
2. The work on the Harvard spectrograms has been carried out by
the method that was described in the preliminary report (H.B. 805,
1924). The plates were all made with the sixteen-inch refractor,
461using two prisms and a special set of apertures. The different apertures
provide relative objective areas of 16, 8, 4, 2, and 1, respectively.
The apertures are rectangular, and the successive reducing strips are
placed perpendicular to the refracting edge of the prism. It is assumed
in the discussion that the amounts of light admitted by the
apertures are in the same ratio as their areas.
A standard procedure has been adopted in securing the spectrograms.
A series of spectra with the several apertures was obtained
upon each plate. Focus, clock rate, and exposure time were kept
constant over any one series. In general the apertures were used in
the order 16, 8, 4, 2, 16. Aperture 1 was omitted in nearly every case,
and for a few stars other apertures were also omitted, or found to be
useless owing to faintness of the image. Omission of apertures is
indicated by notes to Table I.
| TABLE I |
|---|
| List of Plates Used |
|---|
| Plate Number |
Star |
Spectral Class |
Apertures |
Remarks |
| MC 20790 |
α Lyrae |
A0 |
1, 16a, 8, 4, 2 |
Ap. 2 not used |
| 20797 |
α Bootis |
K0 |
1, 16a, 8, 4, 2, 16b |
Ap. 1 and 2 not used |
| 20800 |
α Aquilae |
A5 |
1, 16a, 8, 4, 2, 16b |
Ap. 1 and 2 not used |
| 21640 |
α Cygni |
cA2 |
16a, 8, 4, 2, 16b |
|
| 21645 |
δ Cassiopeiae |
A5 |
16a, 8, 4, 2, 16b |
|
| 21646 |
α Cassiopeiae |
K0 |
16a, 4, 2, 16b |
Ap. 16b not used |
| 21721 |
α Aurigae |
G0 |
16a, 8, 4, 2, 16b |
|
| 21722 |
δ Canis Majoris |
cF8 |
16a, 8, 4, 2, 16b |
Ap. 16b not used |
| 21788 |
β Orionis |
cB8 |
16a, 8, 4, 2, 16b |
Ap. 16b not used |
| 21789 |
ε Orionis |
B0 |
16a, 8, 4, 2, 16b |
Ap. 16b not used |
| 21802 |
α Canis Majoris |
A0 |
8, 16, 4, 2 |
|
The apertured spectra were examined, and any that showed irregularities
were rejected. In cases of interference by clouds, whether
or not the spectra were visibly impaired, the plates were not measured.
Spectra which appeared from experience to be too strong or too weak
for satisfactory analysis were also rejected.
4623. The present report deals with the spectra of the eleven stars
enumerated in Table I. Successive columns contain the plate number,
the name of the star, its spectral class, the apertures employed,
and remarks.
In addition to the plates enumerated in Table I, the following focus
plates were obtained.
| Plate |
Star |
Apertures |
Remarks |
| 21648 |
α Canis Majoris |
16, 4, 4, 4, 4, 4, 4, 4, 4, 4, 16 |
Various focus settings |
| 21803 |
α Canis Majoris |
16, 16, 4, 2, 8, 8, 8, 8, 8, 16 |
4. All the plates have been analyzed by means of the Moll thermoelectric
microphotometer of Harvard Observatory,[3] which furnishes
a photographic record of the plate density. The adjustments of this
instrument were made with several ends in view. The analyzing
beam of light was kept as narrow as possible, so that no integrating
effect should enter into the final result. At the same time it was
desired that the total galvanometer deflection—the quantity on which
the measures depend—should be of reasonable size; otherwise the
errors of measurement would become proportionately too great.
Some of the analyzed spectra, especially those of fainter stars, were
so narrow that the slit admitting the analyzing beam had to be considerably
shortened. This cut down the total light transmitted in
the same proportion, and to keep the deflections of the galvanometer
of reasonable size, a wider slit, and therefore a wider analyzing beam,
had to be used. A compromise was worked out, for each plate,
between a narrow analyzing beam and a reasonable galvanometer deflection.
Special precautions were taken to secure the greatest uniformity of
conditions possible throughout the analysis of each series of spectra
of any one star. At first it was hoped that the whole series of plates
could be analyzed under exactly uniform conditions. Owing to the
narrowness of some of the spectra, however, it was necessary to introduce
the modifications indicated in the preceding paragraph. Even
463if all the spectra had been analyzed under precisely the same conditions,
experience showed that direct intercomparison between different
stars would have been impossible, owing to varying amounts
of fog on different plates.
The instrumental settings were made and recorded at the beginning
of the analysis of each series of spectra, and when possible were kept
untouched throughout the process. The voltage supplying the
analyzing beam, and the temperature of the room, were recorded at
the beginning and end of each analysis, since both these factors may
affect the galvanometer deflection.
| TABLE II |
|---|
| Plate Number |
Star |
Slit Width mm. |
Slit Length mm. |
Total Deflection scale div. |
| MC 20790 |
α Lyr |
.25 |
6.0 |
77 |
| 20797 |
α Boo |
.10 |
7.0 |
35 |
| 20800 |
α Aql |
.10 |
7.0 |
42 |
| 21640 |
α Cyg |
.10 |
5.5 |
30 |
| 21645 |
δ Cas |
.10 |
4.0 |
35 |
| 21646 |
α Cas |
.40 |
3.0 |
45 |
| 21648 |
α CMa |
.25 |
4.0 |
67 |
| 21721 |
α Aur |
.25 |
5.0 |
62 |
| 21722 |
δ CMa |
.25 |
5.0 |
74 |
| 21788 |
β Ori |
.25 |
6.5 |
91 |
| 21789 |
ε Ori |
.25 |
6.0 |
69 |
| 21802 |
α CMa |
.25 |
6.0 |
90 |
| 21803 |
α CMa |
.25 |
6.0 |
85 |
The instrumental settings for the different plates analyzed are
summarized in Table II. Successive columns contain the plate
number, the name of the star, the width in millimeters of the slit
producing the analyzing beam, and the total length of that slit. The
effective width of the slit producing the analyzing beam differs somewhat
from the quantity recorded in the third column. For the three
entries .10, .25 and .40, the corresponding effective slit widths are
.101, .262, and .385 mm., respectively. The corresponding widths
in millimeters of the analyzing beam are 0.010, 0.026, and 0.038, respectively,
which are approximately equivalent to .02, .05, and
.08 angstroms at Hδ for the dispersion used in this series of plates.
4645. Measurement of microphotometer tracings.—In addition to the
line representing the density of the image at different points along the
spectrum, reference marks were inserted by registering a line for
“darkness,” by interposing an opaque screen in the path of the
analyzing beam, and a line for “clear film,” by passing the beam
through the plate background close to the spectrum, though not close
enough to bring it within range of disturbing photographic effects
due to the image.
The microphotometer tracings on paper prints were measured with
respect to the reference marks. Lines, representing “darkness” and
“clear film,” were ruled from end to end of the tracing, and across the
absorption lines a curve was drawn, completing the curve of the neighboring
continuous background. For early type stars this background
curve can be drawn without ambiguity; but when the spectrum is
rich in lines, the course of the unlined continuous background is
largely a matter of judgment.
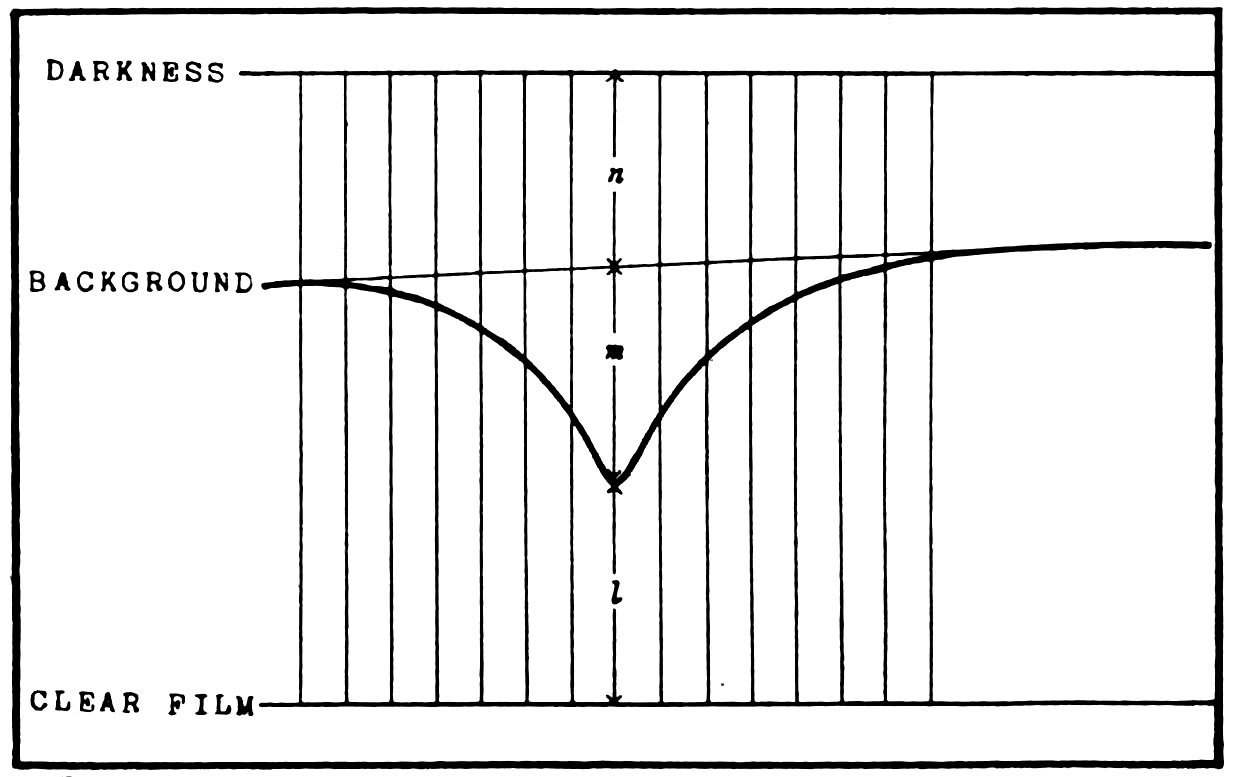
Figure 2.—Diagram of an absorption line, as registered by the microphotometer, showing the method of measuring the tracings. The quantities n (“darkness” to “background curve”), m (“background curve” to “line”), and l (“line” to “clear film”) were measured at intervals of five scale divisions, indicated by the vertical lines.
The quantities measured on the microphotometer tracings are best
described by a diagram. Figure 2 represents a wide absorption line,
465and the various distances that were measured in analyzing such a line.
The measures were all made with a half-millimeter réseau scale photographed
upon glass, which was laid directly upon the tracing.
6. Method of reduction.—The spectra obtained with various apertures
provide, as was pointed out in Harvard Bulletin 805, several
measures of the intensity at any point of an absorption line. The intensity
is compared, in the present paper, with the intensity that the
continuous background would have at the same point if the line were
not present, which is assumed to be represented by the “background
curve” drawn across the absorption line.
The method has the advantage of making a determination separately
for each wave length. The difficulties introduced by the varying
color sensitivity of the photographic plate are thus avoided. It has,
however, the disadvantage that the measured quantity depends to
some extent upon the individual judgment of the investigator in
drawing the “background curve”—a matter that is simple for Classes
B and A, but may prove serious for second-type stars.
The intensity differences, background minus line, were determined
for several points by direct measurement. The distances, n and
m + n for the same wave length in all the spectra of any one series,
were obtained from the microphotometer tracings, and were separately
plotted against the logarithms of the corresponding apertures.
Smooth curves were drawn, joining the plotted points for any one
wave length, as in Figure 3. The drawing of the curves is somewhat
simplified by considering together several for the same star, remembering
that the sections lying between the same abscissae should be
roughly parallel. These various curves represent different sections
of the familiar characteristic curve for photographic blackening, the
logarithm of the aperture being here substituted for the more usual
logarithm of the intensity. Differences of intensity between line and
background are then readily obtained by interpolating values of n
on the curve connecting m + n and aperture, and similarly by interpolating
values of m + n on the curve connecting aperture with
measured values of n. Each spectrum thus furnished at least one,
and sometimes two, values for the intensity difference at any point.
It will be seen from Table IX that for several stars two mean values
of line intensity are given, one being the mean of all the measures, and
the other the “selected mean.” The selected means are obtained by
using only points from the more linear portions of the characteristic
curve, and by rejecting values derived from microphotometer tracings
of exceptional total deflection.
466
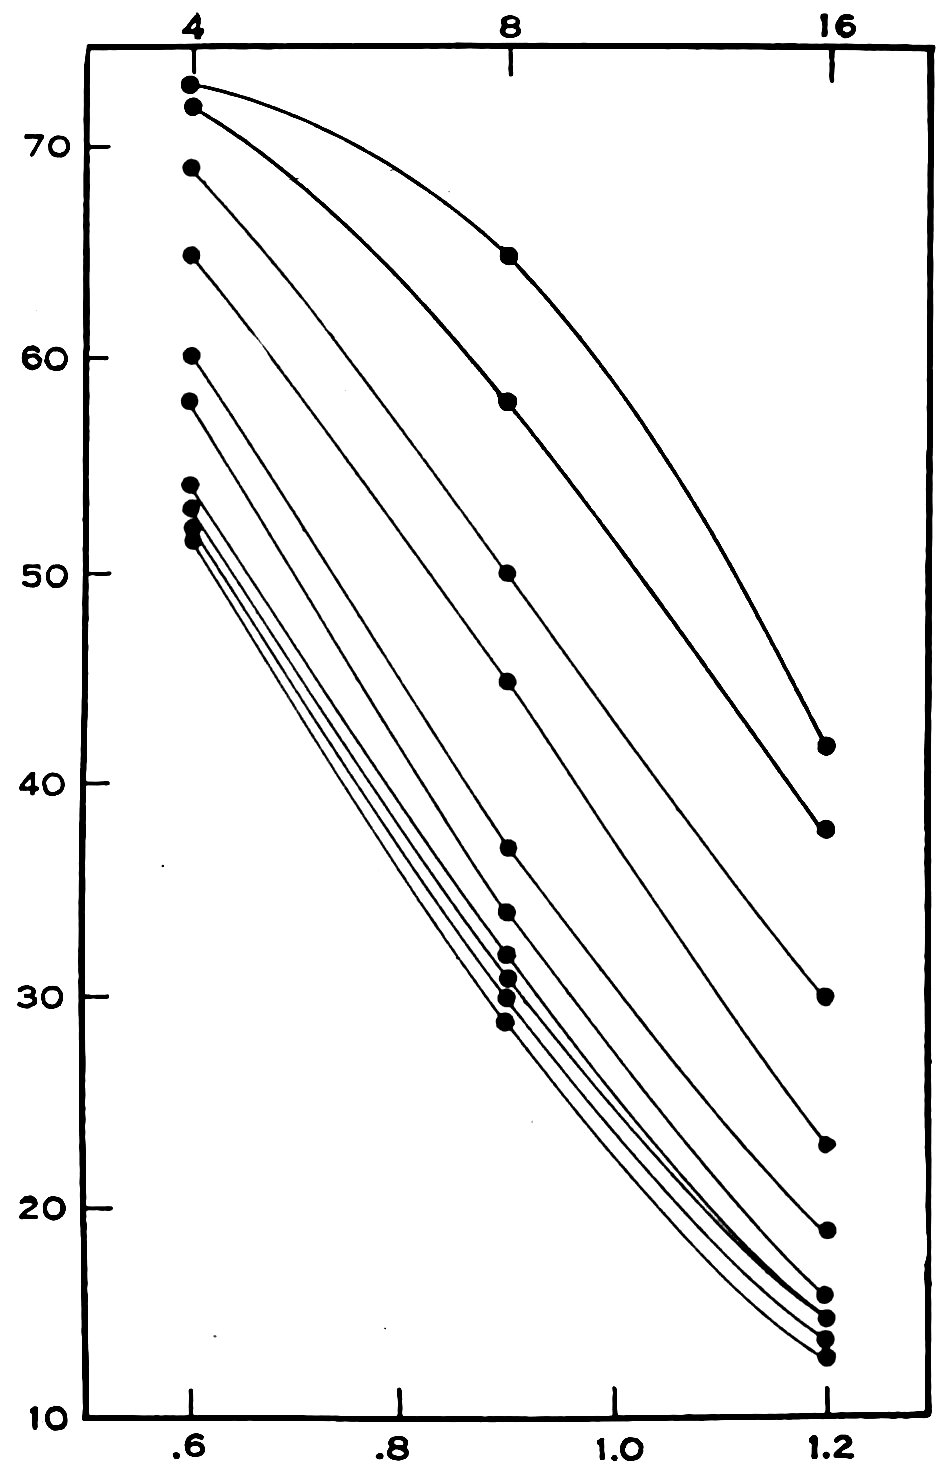
Figure 3.—Relation between galvanometer deflection (representing plate density) and aperture (representing light intensity), from measures of the microphotometer tracings made from the apertured spectra of α Lyrae, MC 20790. Ordinates are galvanometer deflections in scale divisions, abscissae are (above) apertures, (below) logarithms of apertures. Smooth curves are drawn joining the points corresponding to the same wave length, for the three apertures represented.
The intensity drop from background to line is thus obtained in the
form log. intensity of background minus log. intensity of line. The
467change in intensity may readily be converted into stellar magnitudes
by dividing the difference of the logarithms by 0.4.
7. The results embodied in the present paper differ so materially
from those of some previous workers, that it is of especial interest to
examine the accuracy that may be claimed for each stage of the work,
and the weight that may be assigned to the results, (Cf. Harvard
Monograph No. 1, p. 51). Three stages of the investigation should
be considered separately; the plates, (a and b), the microphotometer
records (c), and the measures (d).
a. Accuracy of plates.—A qualitative test of the reliability of the
spectra used is made by examining the reproduction of line detail
throughout the whole series made for one star. Figure 4 shows the
microphotometer tracings for a portion of the spectrum of δ Canis
Majoris, made with apertures 16, 8, and 4. Figure 5 shows a similar
series of tracings made from spectra of α Persei, taken with apertures
16, 8, 4, and 2. It may be seen that the reproduction of line detail
is satisfactorily faithful, although a few spurious details can be detected.
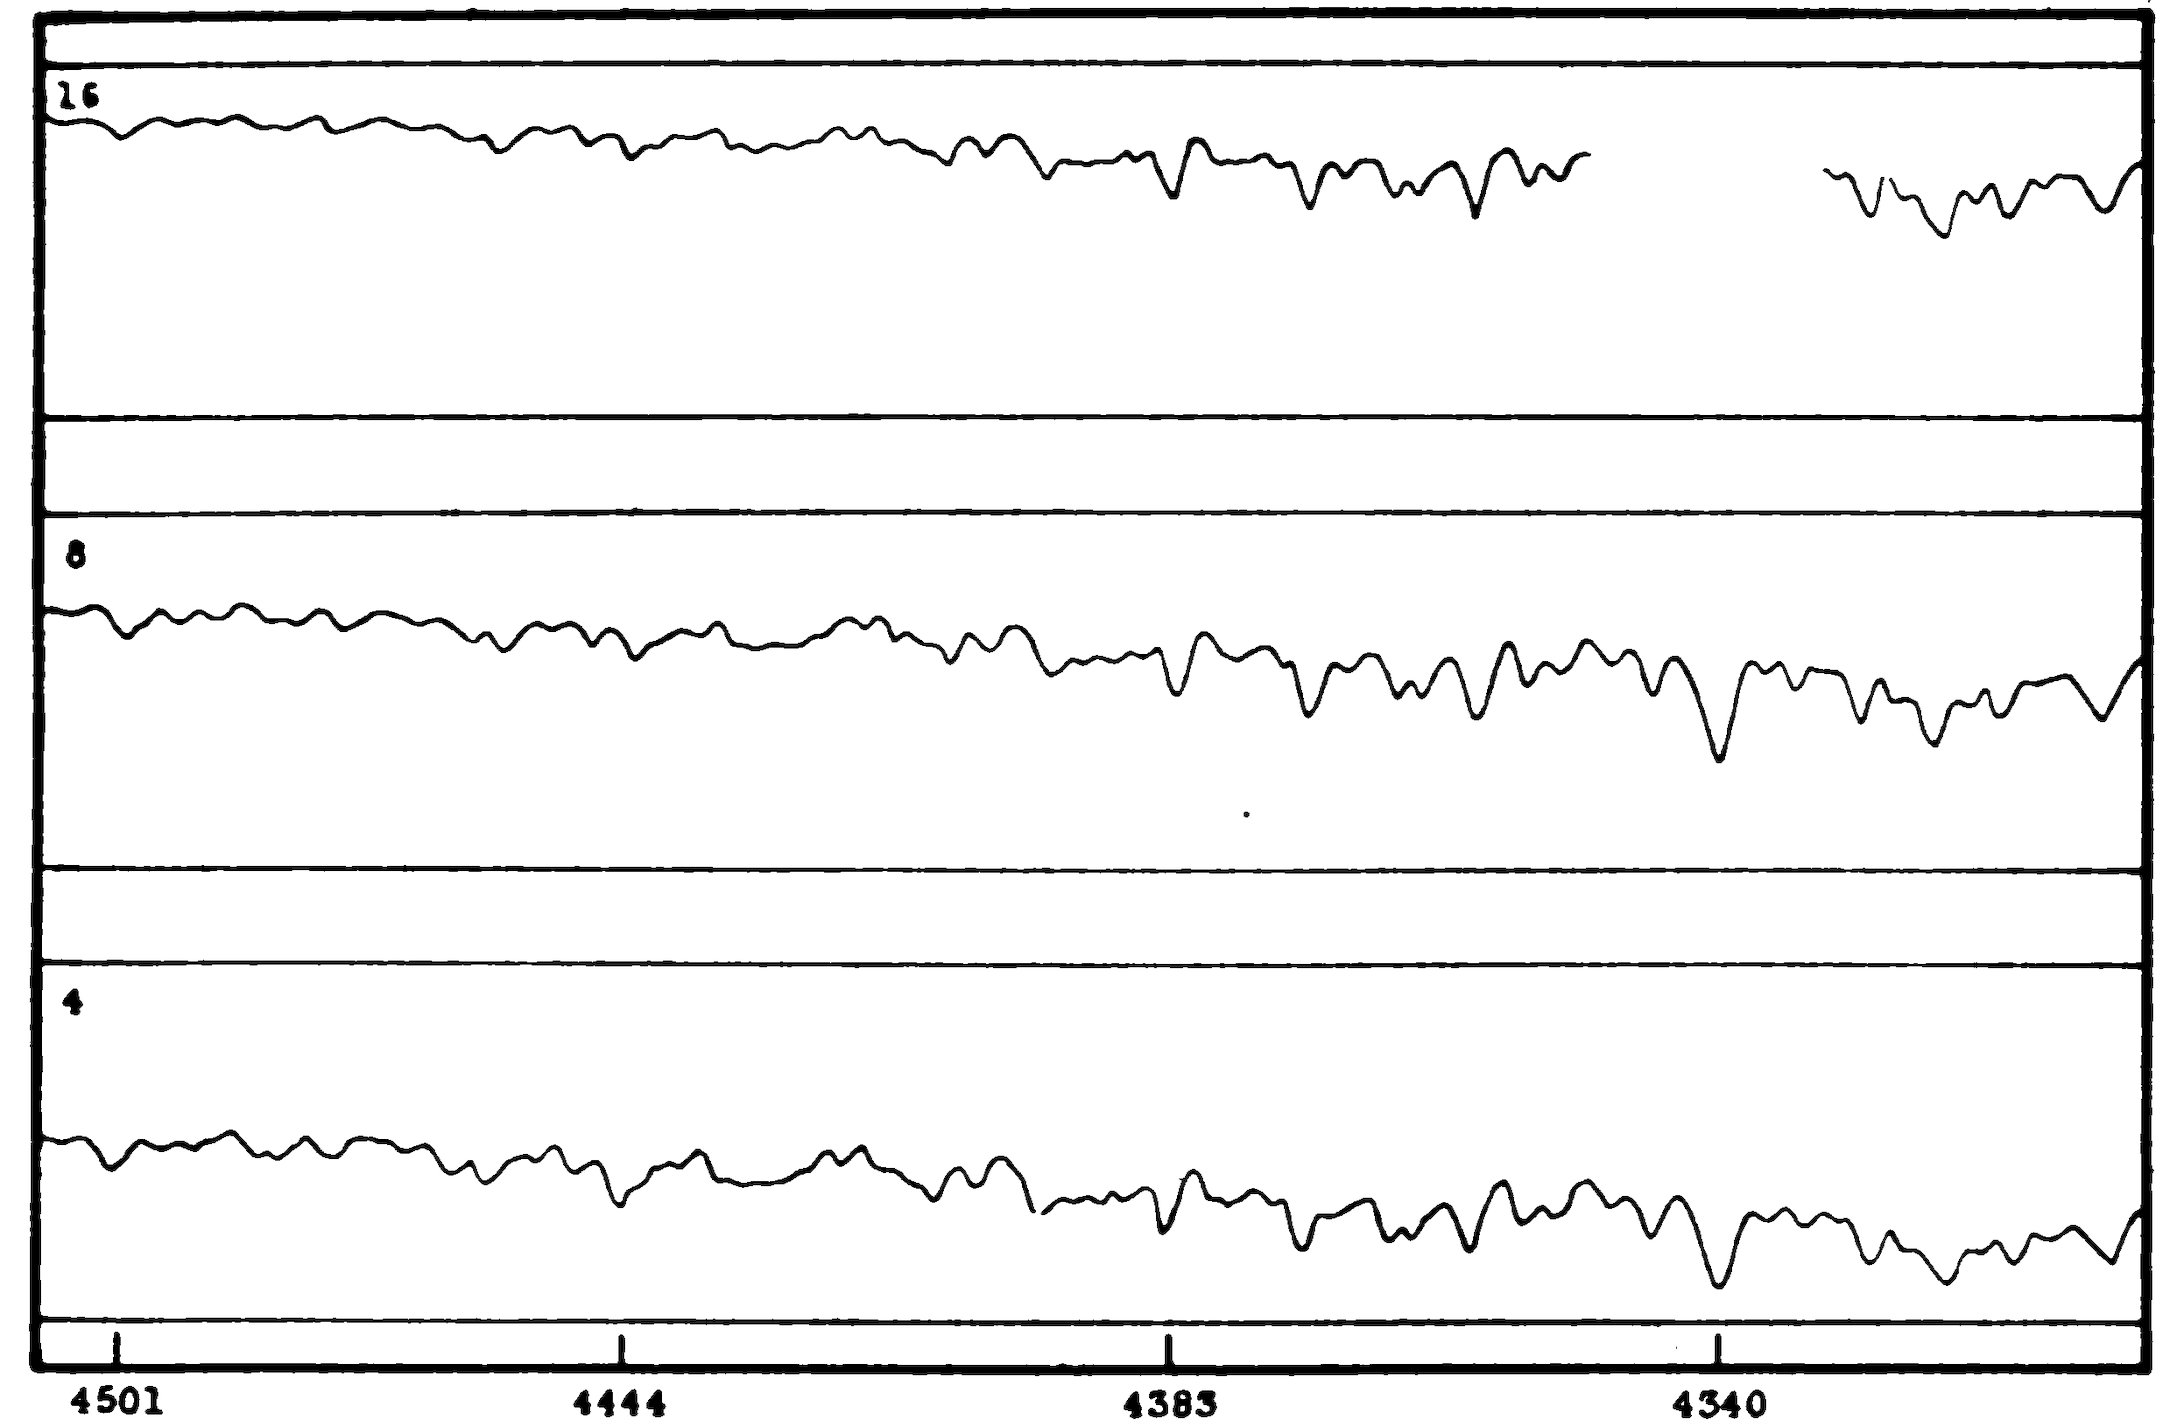
Figure 4.—Microphotometer tracings made from a portion of the Harvard apertured objective prism spectra of δ Canis Majoris, MC 21722. The different apertures used are indicated on the left margin. A few of the more important lines are marked on the lower edge of the diagram.
468
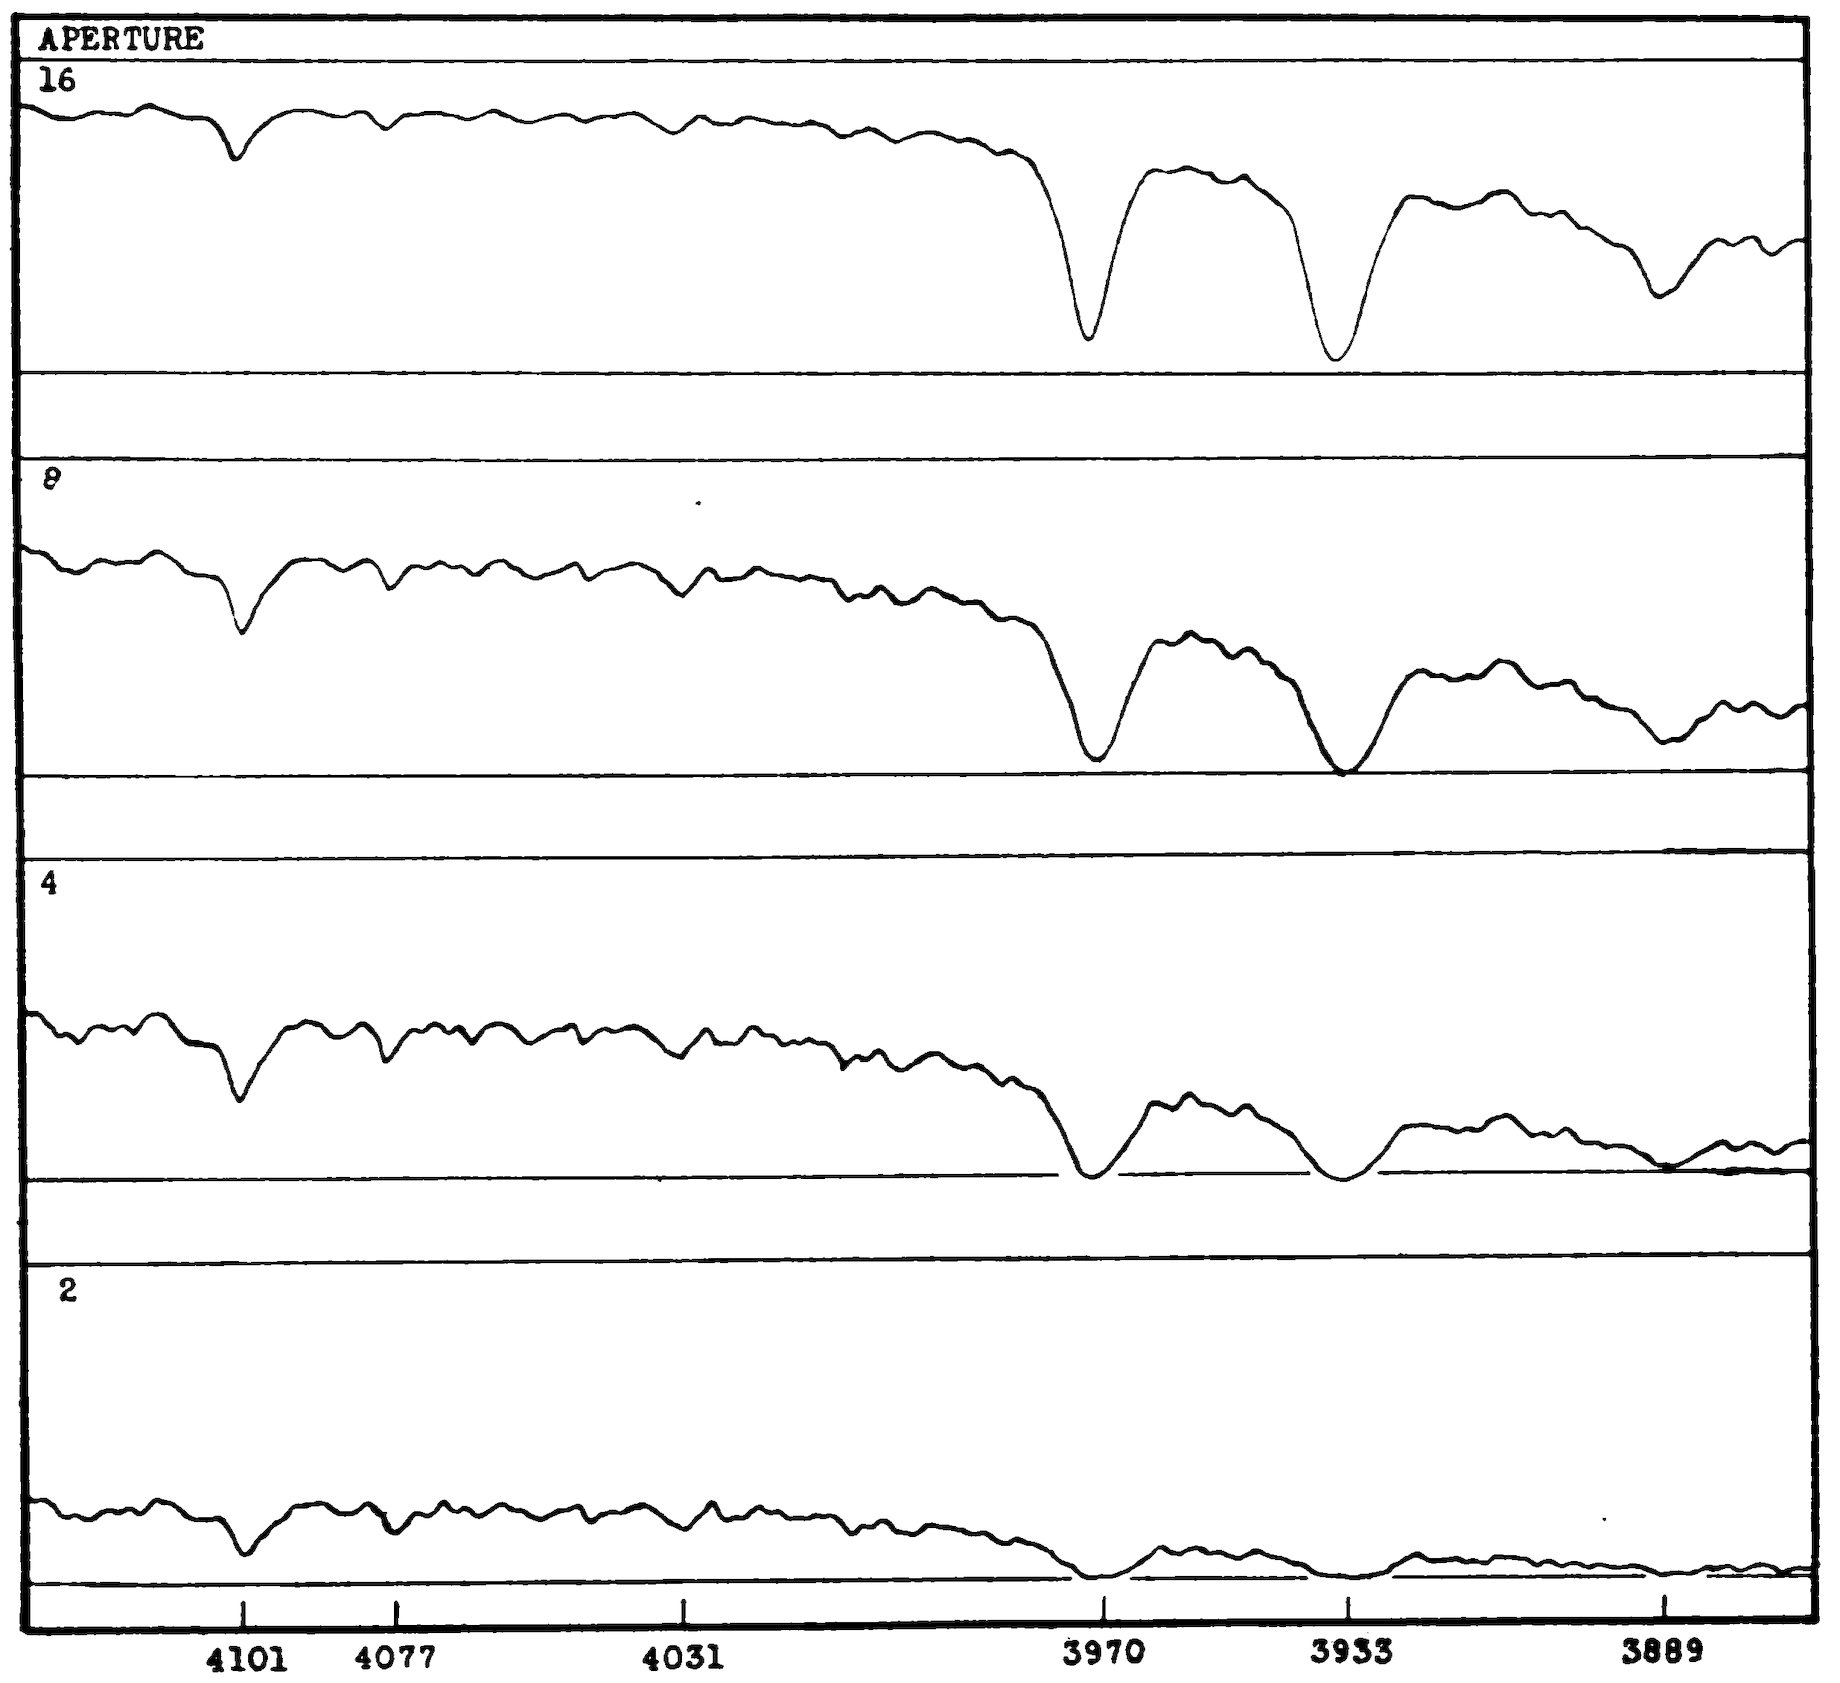
Figure 5.—Microphotometer tracings made from a portion of Harvard apertured objective prism spectra of α Persei. The different apertures used are indicated on the left margin. A few of the more important lines are marked on the lower edge of the diagram.
The best quantitative test of the reliability of the spectra used in
this work is the consistency of the numerical results obtained from the
different members of a series. From Table IX it may be seen that
the residuals very seldom exceed 0.2 m., while the majority are less
than 0.05 m.
In specific criticism of the use of the objective prism in line photometry,
it has been claimed that the intensity at the line center is
affected, and measurably increased, by stray light, and that such an
effect is inappreciable for slit spectra. The results of the present
work, which deals with lines of various depths, widths, and qualities,
are relevant to a discussion of the question, so far as it concerns objective
prism spectra.
469Presumably the effects of stray light must be greatest in the immediate
neighborhood of the stronger portions of the spectrum, and
fall off at greater distances from the more heavily exposed parts of the
plate. Skylight contributes mainly to plate fog, is uniform over the
spectrum and its vicinity, and is eliminated by the use of the line
representing “clear film” as a reference base in measuring the
tracings.
If the effects of stray light are of importance in the immediate vicinity
of the continuous spectrum, they will presumably affect all absorption
lines to some extent, and will in particular be greatest for
narrow lines. The effects should also be greater for heavily exposed
spectra than for the more lightly exposed spectra of the same star.
Further, the effects of stray light should appear not only within absorption
lines, but also alongside of the spectrum on either edge.
A comparison of the results for δ Cassiopeiae and α Aquilae, both
stars of Class A5 (see Table X) shows that the observed line depth is
not, in this case at least, a function of line width. The lines of δ Cassiopeiae
are both narrower and deeper (that is, they show greater
contrast with the background) than those of α Aquilae. The same is
true of δ Canis Majoris and Capella; the lines of the former are both
narrower and deeper.
The results for apertures 16, 8, 4, and 2 have been compared for all
the stars discussed, and the intensity differences between line and
background are not appreciably smaller for the larger apertures, which
would be the case if stray light were an important factor. Indeed,
for α Cygni and β Orionis an opposite effect is shown.
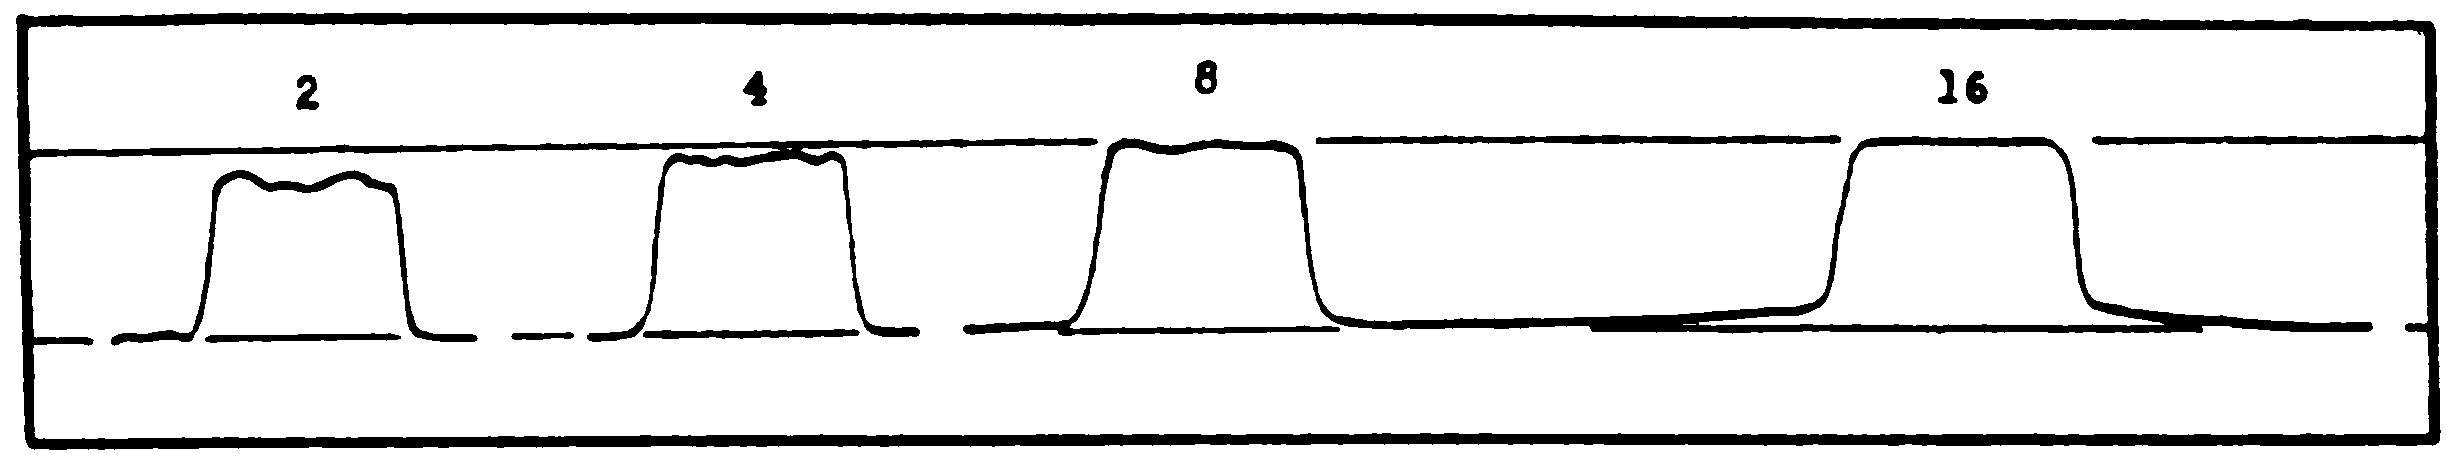
Figure 6.—Microphotometer tracing taken across the spectra of Sirius (MC 21647) made with the different apertures indicated along the upper margin.
To examine the distribution of light at the edges of the spectrum, a
microphotometer tracing was made by running MC 21803 (Sirius)
through the instrument in a direction perpendicular to the length of
the spectra. The resulting tracing is reproduced in Figure 6. Effects
470of stray light are not to be found, except for the strongest spectrum.
Evidently such effects depend on the heaviness of the exposure, but
are not simply proportional to it; they may indicate mainly the
“creep” of the overexposed image rather than stray incident light.
The point of exposure beyond which stray light begins to be a disturbing
factor would have to be determined separately for each plate.
In no case is it likely to involve any but the strongest spectrum, and
spectra that are strong enough to exhibit the effect are for other
reasons not usable. Such measures, in fact, are omitted in deriving
the “selected mean,” and it would seem that effects of stray light are
thus eliminated, while an upper limit may be assigned to their magnitude
by comparing the mean derived from all the measures with the
selected mean in Table IX. Stray light, although certainly present
to some degree, is therefore probably not an important factor in
affecting the results of line photometry with the present objective
prism spectra.

Figure 7.—Microphotometer tracing taken across the spectrum of Vega made with the single prism spectrograph of the Detroit Observatory.
Figure 7 represents the result of a similar test made by taking a
microphotometer tracing across an excellent slit spectrogram of Vega
that was made with the spectrograph at Ann Arbor. There are no
traceable effects of stray light outside the edges of the spectrum, but
on the contrary there is a distinct drop in intensity, which may partly
be due to an Eberhard Effect. The objective prism spectrum therefore
appears to have a slight advantage in this regard, judging from a
comparison of Figures 6 and 7.
b. Effect of focus.—The effect of poor focus in blurring absorption
lines suggests that this factor may enter into the accuracy of the
results. It is not possible, in a stellar spectrograph, when working
with flat plates, to keep all parts of the spectrum in focus at the same
time. Two plates of Sirius were taken for the purpose of examining
the magnitude of the effect. The apertures used, and the focus settings,
were as follows.
| 471 |
| PLATE MC 21648 |
|---|
| Spectrum |
1a |
3a |
3b |
3c |
3d |
3e |
3f |
3g |
3h |
3i |
1b |
| Aperture |
16 |
8 |
8 |
8 |
8 |
8 |
8 |
8 |
8 |
8 |
16 |
| Setting |
17.2 |
17.2 |
17.4 |
17.6 |
17.8 |
18.0 |
17.0 |
16.8 |
16.6 |
17.2 |
17.2 |
| PLATE MC 21803 |
|---|
| Spectrum |
1a |
1b |
2e |
3 |
4 |
2c |
2d |
2b |
2a |
| Aperture |
16 |
16 |
8 |
4 |
2 |
8 |
8 |
8 |
8 |
| Setting |
16.6 |
16.6 |
16.6 |
16.6 |
16.6 |
16.2 |
16.4 |
16.8 |
17.0 |
From MC 21648 it is possible to obtain a qualitative estimate of
focus effects; MC 21803, including spectra taken with all four apertures,
furnishes a quantitative estimate of the magnitude of the focus
errors. Microphotometer tracings were made, under uniform conditions,
of the spectra of each of the focus plates, and measures were
made at the centers of the lines only.
For the plate MC 21648, the observing record book contains the
entry: “Frost in center of prism at close.” Apparently the frosting
resulted in a gradual decrease in the intensity of successive spectra,
which is shown, when the spectra are arranged in the order in which
they were photographed, by a gradual decrease in n, a quantity that
should remain constant for the same aperture, since the edges of the
spectrum, the portion where focus would affect the intensity, are not
crossed by the analyzing beam of the microphotometer. The progressive
change in n is shown in Table III.
| TABLE III |
|---|
| Spectrum |
3a |
3b |
3c |
3d |
3e |
3f |
3g |
3h |
3i |
| n at Hβ |
13 |
(12) |
13 |
15 |
16 |
16 |
17 |
18 |
17 |
| Hγ |
8 |
8 |
8 |
11 |
9 |
10 |
11 |
10 |
11 |
| Hδ |
11 |
9 |
10 |
12 |
12 |
14 |
12 |
13 |
15 |
| Hε |
16 |
14 |
17 |
15 |
18 |
19 |
19 |
19 |
20 |
| K |
19 |
17 |
19 |
18 |
20 |
22 |
21 |
22 |
23 |
| Hζ |
27 |
25 |
28 |
29 |
29 |
31 |
31 |
31 |
33 |
That the change in n is progressive and not due to change of focus
is shown by arranging the columns in the order of focus setting, 3h,
3g, 3f, 3i, 3a, 3b, 3c, 3d, 3e. No regular change in n is then evident.
The total deflection of the galvanometer is satisfactorily constant
for all the microphotometer records of the spectra on MC 21648, excepting
3i, which is rejected for a large voltage drop (0.2 volts),
472producing a reduction of four scale units in total deflection. Spectrum
3i is omitted from further discussion. The quantity l must be
corrected for change in n, and this may be done by adding to l a
quantity equal to the increase in n, since the observed change in n,
which should be constant, corresponds to a shift of the whole spectrum,
tending to decrease l. The change in l, the distance from
“clear film” to line center, as measured on the microphotometer
tracings, with changing focus, is shown in Table IV. Values of l are
corrected.
| TABLE IV |
|---|
| Spectrum |
3h |
3g |
3f |
3a |
3b |
3c |
3d |
3e |
| Focus |
16.6 |
16.8 |
17.0 |
17.2 |
17.4 |
17.6 |
17.8 |
18.0 |
| l at Hβ |
33 |
36 |
40 |
47 |
49 |
49 |
48 |
43 |
| Hγ |
37 |
38 |
39 |
47 |
47 |
50 |
46 |
47 |
| Hδ |
32 |
35 |
31 |
40 |
41 |
45 |
43 |
40 |
| Hε |
24 |
26 |
27 |
33 |
33 |
35 |
37 |
31 |
| K |
42 |
44 |
42 |
50 |
50 |
52 |
54 |
47 |
| Hζ |
12 |
14 |
13 |
19 |
18 |
22 |
24 |
20 |
The line depth is the greatest, and the focus presumably the best,
where l is smallest. It appears that spectrum 3h is at best focus.
Table V contains the values of m for different focus settings, in the
same form as Tables III and IV. The quantity m requires no correction
for change of n. For all the spectra on this plate the K line
appears double. The last line of Table V contains the distance, in
scale divisions, between the two maxima of the K line on the microphotometer
tracing. One scale division corresponds approximately
to one Angstrom.
| TABLE V |
|---|
| Spectrum |
3h |
3g |
3f |
3a |
3b |
3c |
3d |
3e |
| Setting |
16.6 |
16.8 |
17.0 |
17.2 |
17.4 |
17.6 |
17.8 |
18.0 |
| m at Hβ |
16 |
16 |
14 |
13 |
13 |
12 |
9 |
11 |
| Hγ |
19 |
18 |
18 |
16 |
15 |
14 |
12 |
13 |
| Hδ |
22 |
20 |
20 |
19 |
18 |
17 |
15 |
16 |
| Hε |
24 |
22 |
20 |
21 |
22 |
21 |
21 |
19 |
| K |
3 |
3 |
2 |
2 |
2 |
2 |
2 |
2 |
| Hζ |
24 |
23 |
23 |
24 |
25 |
23 |
29 |
28 |
| Width of K |
4 |
4 |
5 |
5 |
7 |
6.5 |
9 |
9 |
The data of Table V, and the changing width of the K line (thus
shown to be an effect of focus) indicate 3h as being the best focussed
of the nine spectra. This can also be seen visually from the plate.
473The focus plate MC 21803 was similarly analyzed and measured.
No progressive weakening of the spectra is shown by this plate, and
the measures are therefore uncorrected. For the same plate Table
VI shows the change of l with focus setting, in the same form as Table
IV.
| TABLE VI |
|---|
| Spectrum |
2c |
2d |
2e |
2b |
2a |
| Setting |
16.2 |
16.4 |
16.6 |
16.8 |
17.0 |
| l at Hβ |
51 |
52 |
51 |
54 |
53 |
| 4481 |
77 |
78 |
79 |
79 |
81 |
| Hγ |
54 |
55 |
56 |
55 |
56 |
| Hδ |
47 |
48 |
51 |
50 |
50 |
| Hε |
39 |
39 |
42 |
43 |
41 |
| K |
62 |
64 |
65 |
65 |
64 |
| Hζ |
22 |
26 |
28 |
28 |
26 |
| Hη |
8 |
10 |
12 |
12 |
8 |
| Hθ |
4 |
5 |
4 |
6 |
2 |
Table VII is in the same form as Table V, and represents the change of
m with changing focus. Evidently Spectrum 2c is at best focus.
| TABLE VII |
|---|
| Spectrum |
2c |
2d |
2e |
2b |
2a |
| Setting |
16.2 |
16.4 |
16.6 |
16.8 |
17.0 |
| m at Hβ |
22 |
22 |
21 |
20 |
19 |
| 4481 |
3 |
3 |
2 |
2 |
2 |
| Hγ |
24 |
24 |
23 |
23 |
25 |
| Hδ |
28 |
27 |
26 |
27 |
26 |
| Hε |
31 |
31 |
30 |
28 |
30 |
| K |
6 |
5 |
5 |
4 |
4 |
| Hζ |
36 |
33 |
34 |
33 |
34 |
| Hη |
32 |
31 |
30 |
30 |
31 |
| Hθ |
20 |
19 |
20 |
19 |
19 |
By the use of the four apertured spectra that occur on MC 21803 it
is possible to evaluate the differences of intensity, produced by the
change of focus, directly in stellar magnitudes. The method used in
deriving the intensities is the one employed in compiling Table IX.
The intensities at the centers of the lines of the various spectra are
summarized in Table VIII. It appears that Spectrum 2c is at best
focus for lines at either end of the spectrum, and that the curve of best
focus moves towards 2b for intermediate lines. The effect is what
would have been anticipated on general grounds. The magnitude of
474the effect is satisfactorily small, as may be seen by comparing the differences
in Table VIII with the residuals in Table IX. Errors arising
from bad focus, while they are of appreciable size, do not exceed the
errors due to other causes. If the spectra to be analyzed appear upon
visual examination to be in good focus, they will probably not give
results impaired by serious focus error.
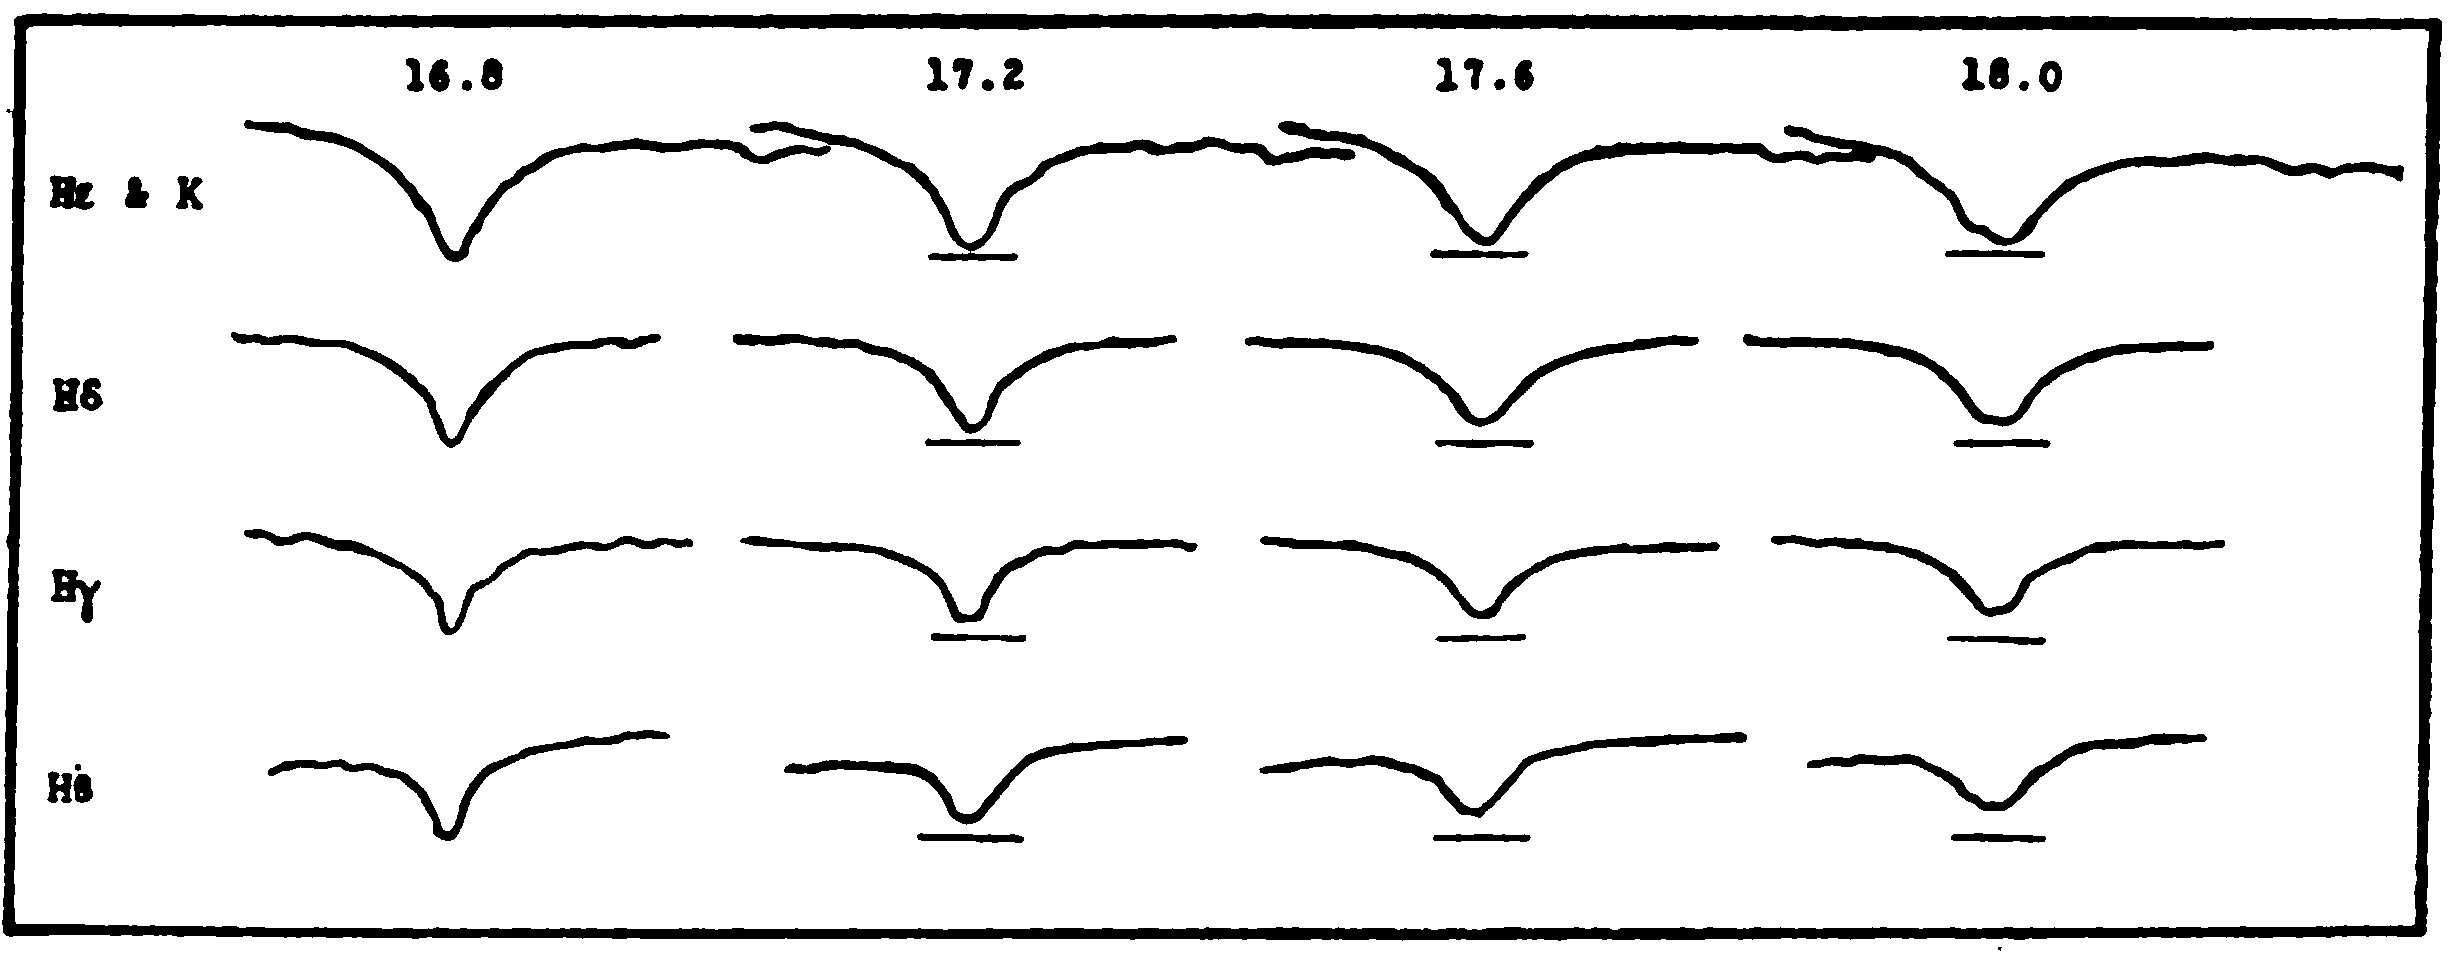
Figure 8.—Microphotometer tracings made from Harvard objective prism spectra of Sirius, MC 21648, to illustrate the effects of focus. Analyses are shown of the five lines indicated on the left margin, for the focus settings given above. The best focus is at 16.8; the short lines below the absorption minima indicate the change in line depth with changing focus. The doubling of the K line, and the increasing distance between the components, is a noticeable effect of focus.
Figure 8 shows, for MC 21648, the lines Hβ, Hγ, Hδ, Hε, and K,
for four out of the nine focus settings. The change in line depth, and
the blunting of the intensity curve, are at once apparent.
| TABLE VIII |
|---|
| Spectrum |
2c |
2d |
2e |
2b |
2a |
| Setting |
16.2 |
16.4 |
16.6 |
16.8 |
17.0 |
| Hβ |
.53 |
.53 |
.51 |
.49 |
.47 |
| 4481 |
.13 |
.13 |
.09 |
.09 |
.09 |
| Hγ |
.60 |
.59 |
.60 |
.60 |
.63 |
| Hδ |
.63 |
.65 |
.65 |
.66 |
.62 |
| Hε |
.62 |
.62 |
.66 |
.62 |
.65 |
| K |
.15 |
.14 |
.13 |
.12 |
.10 |
c. Accuracy of microphotometer records.—As was pointed out in
Harvard Bulletin 805, the width of the analyzing beam, which is not
in any case greater than one-tenth of an Angstrom, is such that no
smoothing effect need be considered at the line center.
475In a few cases the same line of the same spectrum was registered
twice. The measures made upon the two tracings were always satisfactorily
accordant.

Figure 9.—Test of the consistency of spectra taken with different apertures.
Ordinates are distance from “clear film” to “line center” taken from microphotometer tracings of spectra of α Aquilae, MC 20800. Abscissae are the ratio (l + m for one aperture)/(l + m for twice the aperture). The fact that the points lie on a smooth curve indicates that the results are satisfactorily consistent.
The consistency of the results given by the tracings of several
spectra of the same star, when photographed with different apertures,
may be examined by means of the plot shown in Figure 9. Ordinates
are values of l + m. Abscissas are values of the ratio
((l + m) for one aperture)/((l + m) for twice the aperture).
It is evident that if the points thus derived fall on a smooth curve, the
results derived from different tracings of the same spectrum will be
mutually consistent. The method of interpolation described in
Section 6 may therefore be used in deriving the differences of intensity
between line and background.
If the method of Section 6 is to be successfully applied, it is essential
that the total range (“darkness” to “clear film”) shall be uniform for
a single series of tracings. In general the variations in total range do
476not exceed three or four scale units, but, for some spectra, occasional
changes of eight or ten units have occurred, generally owing to changes
of voltage or room temperature.
Under these circumstances, it has been thought best not to attempt
to apply any correction for variations in total range, but to reject
from the “selected mean” readings from spectra that gave very discordant
total ranges.
d. Accuracy of measures. In comparison with the errors of the
plates and of the microphotometer tracings, the errors in the measurement
of the records are of relative unimportance. The chief difficulty,
as mentioned above, is that of drawing from fiducial points the reference
lines representing the continuous background and the “clear
film.” The error thus introduced may occasionally amount to one
millimeter, or two divisions of the scale.
It is sometimes difficult to decide upon the position of the center of
a line, especially when it is wide, without a sharp maximum. This
may lead to large residuals for measures on the wings, especially for
such lines as Hε and Hζ.
8. The results of the investigation are given in Table IX, which
contains, in successive columns, the name of the line, the wave length,
expressed to the nearest Angstrom, the mean value of the difference
of intensity, background minus line, expressed in stellar magnitudes,
the residuals, the “selected mean” value of the same intensity difference
(see Section 6) and its residuals. The stars are mentioned at
the beginnings of their respective records, and are arranged in order
of plate number. In the case of stars for which no “selected mean”
is quoted, all the values used for the mean conform to the criterion for
“selected mean.”
| TABLE IX |
| Differences of Intensity, background minus LINE |
| Plate and Star |
Wave Length |
Mean Intensity Difference |
Residuals |
Selected Mean Difference |
Residuals |
| MC 20790 |
4877 |
.11 |
1, 4, 4 |
.11 |
4, 4 |
| α Lyrae |
4872 |
.23 |
2, 3, 2 |
.23 |
3, 2 |
| |
4866 |
.49 |
2, 1, 1 |
.50 |
|
| |
4861 Hβ |
.95 |
10, 0, 7, 5 |
.95 |
|
| |
4856 |
.73 |
2, 3, 2, 3 |
.73 |
3, 2 |
| |
4851 |
.35 |
5, 5, 2, 3 |
.38 |
2, 1 |
| |
4846 |
.17 |
5, 3, 3, 0 |
.19 |
1, 1, 2 |
| |
4840 |
.07 |
2, 0, 3, 2 |
.07 |
0, 3, 2 |
| 477 |
4358 |
.11 |
6, 9, 6, 6, 1 |
.10 |
8, 7 |
| |
4354 |
.23 |
11, 1, 9, 4 |
.27 |
5, 5 |
| |
4349 |
.45 |
15, 0, 15, 2 |
.52 |
7, 8 |
| |
4345 |
.83 |
8, 3, 19, 8 |
.86 |
6, 16, 11 |
| |
4340 Hγ |
1.43 |
6, 19, 6, 3, 3 |
1.62 |
|
| |
4336 |
.92 |
8, 17, 5, 3 |
.92 |
8, 17, 5, 3 |
| |
4331 |
.51 |
19, 4, 11, 14, 11 |
.55 |
0, 15, 10, 7 |
| |
4327 |
.25 |
8, 5, 5, 15, 12, 10 |
.29 |
9, 9, 11, 8 |
| |
4322 |
.14 |
2, 4, 4, 11, 8, 7 |
.17 |
7, 7, 8, 5 |
| |
|
|
|
|
|
| |
4116 |
.13 |
3, 4, 9, 8 |
.19 |
2, 3 |
| |
4112 |
.32 |
10, 3, 8 |
.37 |
2, 3 |
| |
4109 |
.60 |
15, 2, 12 |
.67 |
5, 5 |
| |
4105 |
.92 |
17, 18, 17, 13, 5 |
.92 |
18, 17 |
| |
4102 Hδ |
1.60 |
0, 22, 15, 5 |
1.82 |
|
| |
4098 |
1.11 |
|
1.11 |
|
| |
4095 |
.72 |
17, 8, 8 |
.80 |
0, 0 |
| |
4091 |
.33 |
1, 7, 1, 3 |
.36 |
4, 4 |
| |
4088 |
.21 |
6, 1, 4, 9 |
.22 |
2, 5, 8 |
| |
4084 |
.13 |
6, 3, 3, 12 |
.15 |
5, 5, 10 |
| |
|
|
|
|
|
| |
3986 |
.11 |
1, 1 |
.11 |
1, 1 |
| |
3983 |
.21 |
4, 1, 6, 9, 6 |
.23 |
1, 8, 7, 4 |
| |
3980 |
.45 |
10, 0, 5, 7, 10 |
.48 |
3, 8, 4, 7 |
| |
3976 |
.73 |
26, 7, 14, 4 |
.80 |
|
| |
3973 |
1.08 |
6, 5, 3, 2 |
1.17 |
|
| |
3970 Hε |
1.68 |
8, 7 |
1.60 |
|
| |
3967 |
1.17 |
|
|
|
| |
3964 |
.70 |
13, 8, 20 |
.62 |
|
| |
3960 |
.56 |
21, 4, 14, 4 |
.65 |
5, 5 |
| |
3957 |
.28 |
11, 2, 3, 12 |
.32 |
2, 7, 8 |
| |
3954 |
.13 |
3, 3, 1, 7 |
.13 |
3, 3, 1, 7 |
| |
|
|
|
|
|
| |
3936 |
.05 |
0, 0 |
.05 |
0, 0 |
| |
3933 K |
.23 |
1, 3, 3, 7 |
.23 |
1, 3, 3, 7 |
| |
3930 |
.11 |
1, 4, 4, 4, 4 |
.11 |
1, 4, 4, 4, 4 |
| |
|
|
|
|
|
| |
3899 |
.55 |
5, 5, 2, 0 |
.50 |
|
| |
3895 |
.76 |
1, 1, 1, 1 |
.77 |
|
| |
3892 |
1.03 |
4, 3 |
1.07 |
|
| |
3889 Hζ |
1.42 |
|
|
|
| |
3887 |
1.10 |
|
1.10 |
|
| |
3884 |
.78 |
3, 2, 3, 2 |
.75 |
|
| |
3880 |
.43 |
1, 1, 1, 2 |
.42 |
|
| |
|
|
|
|
|
| |
3845 |
.62 |
|
|
|
| |
3842 |
> .75 |
|
|
|
| 478 |
3839 |
> .75 |
|
|
|
| |
3835 Hη |
> .75 |
|
|
|
| |
3832 |
.75 |
|
|
|
| |
3829 |
.25 |
|
|
|
| |
3826 |
.16 |
|
|
|
| MC 20797 |
4340 Hγ |
.54 |
2, 1, 1 |
|
|
| α Bootis |
4227 Ca |
1.34 |
2, 2, 3 |
|
|
| |
4215 Sr+ |
.50 |
7, 8 |
|
|
| |
4101 Hδ |
.74 |
2, 3, 2 |
|
|
| MC 20800 |
4877 |
.00 |
0, 0 |
.00 |
0, 0 |
| α Aquilae |
4872 |
.12 |
5, 5 |
.12 |
5, 5 |
| |
4866 |
.36 |
6, 6 |
.30 |
|
| |
4861 Hβ |
.71 |
1, 1 |
.70 |
|
| |
4856 |
.45 |
5, 5 |
.45 |
5, 5 |
| |
4851 |
.20 |
5, 5 |
.20 |
5, 5 |
| |
4846 |
.15 |
3, 2 |
.15 |
3, 2 |
| |
4840 |
.09 |
7, 8 |
.09 |
7, 8 |
| |
|
|
|
|
|
| |
4363 |
.06 |
1, 1 |
.06 |
1, 1 |
| |
4358 |
.11 |
4, 4 |
.11 |
4, 4 |
| |
4354 |
.16 |
4, 4 |
.16 |
4, 4 |
| |
4349 |
.21 |
4, 4 |
.21 |
4, 4 |
| |
4345 |
.39 |
10, 9 |
.49 |
|
| |
4340 Hγ |
.81 |
1, 1 |
.82 |
|
| |
4336 |
.39 |
10, 9 |
.49 |
|
| |
4331 |
.21 |
4, 4 |
.21 |
4, 4 |
| |
4327 |
.16 |
4, 4 |
.16 |
4, 4 |
| |
4322 |
.07 |
0, 0 |
.07 |
0, 0 |
| |
4318 |
.01 |
1, 1 |
.01 |
1, 1 |
| |
|
|
|
|
|
| |
4116 |
.03 |
4, 3 |
.03 |
4, 3 |
| |
4112 |
.10 |
5, 5 |
.10 |
5, 5 |
| |
4109 |
.23 |
7, 8 |
.23 |
7, 8 |
| |
4105 |
.46 |
6, 6 |
.40 |
|
| |
4102 Hδ |
.71 |
1, 1 |
.70 |
|
| |
4098 |
.50 |
5, 5 |
.50 |
5, 5 |
| |
4095 |
.23 |
7, 6 |
.17 |
|
| |
4091 |
.10 |
5, 5 |
.10 |
5, 5 |
| |
4088 |
.01 |
1, 1 |
.01 |
1, 1 |
| |
|
|
|
|
|
| |
3986 |
.20 |
|
.20 |
|
| |
3983 |
.25 |
0, 0 |
.25 |
|
| |
3980 |
.32 |
2, 3 |
.30 |
|
| |
3976 |
.43 |
3, 4 |
.40 |
|
| |
3973 |
.81 |
1, 1 |
.82 |
|
| 479 |
3970 Hε |
> 1.50 |
|
> 1.50 |
|
| |
3967 |
.79 |
1, 1 |
.78 |
|
| |
3964 |
.48 |
13, 14 |
.35 |
|
| |
3960 |
.25 |
12, 13 |
.17 |
|
| |
3957 |
.12 |
2, 3 |
.10 |
|
| |
3954 |
.02 |
|
.02 |
|
| |
|
|
|
|
|
| |
3942 |
.15 |
|
.15 |
|
| |
3939 |
.22 |
2, 3 |
.20 |
|
| |
3936 |
.53 |
3, 4 |
.50 |
|
| |
3933 K |
.79 |
3, 2 |
.82 |
|
| |
3930 |
.51 |
1, 1 |
.50 |
|
| |
3927 |
.07 |
5, 5 |
.12 |
|
| |
3924 |
.05 |
|
.05 |
|
| MC 21640 |
4866 |
.07 |
7, 5, 0, 7, 10, 0, 0 |
.07 |
0, 0, 0 |
| α Cygni |
4861 Hβ |
.33 |
2, 4, 3, 1, 3, 1, 2 |
.32 |
0, 0 |
| |
4856 |
.18 |
4, 3, 1, 2, 3, 1 |
.16 |
1, 1, 1 |
| |
|
|
|
|
|
| |
4345 |
.11 |
1, 1, 1, 1, 1 |
.10 |
0, 0 |
| |
4340 Hγ |
.63 |
1, 2, 16, 4, 17, 16, 2, 7 |
.67 |
2, 3 |
| |
4336 |
.21 |
1, 1, 1, 1 |
.21 |
1, 1 |
| |
|
|
|
|
|
| |
4105 |
.16 |
9, 1, 6, 4, 4, 6 |
.11 |
1, 1, 1 |
| |
4101 Hδ |
.63 |
17, 3, 16, 2, 2 |
.56 |
8, 9 |
| |
4098 |
.37 |
13, 2, 7, 0, 5 |
.31 |
1, 1 |
| |
|
|
|
|
|
| |
3973 |
.25 |
5, 5, 5, 0, 5, 0, 7, 2, 5, 0, 5 |
|
|
| |
3970 Hε |
.70 |
15, 5, 5, 5, 22, 8, 5, 3, 5, 3 |
.66 |
1, 1, 1, 1 |
| |
3967 |
.46 |
24, 4, 19, 14, 1, 4, 16, 14, 16, 4, 1 |
.34 |
7, 2, 8 |
| |
3936 |
.10 |
20, 0, 3, 5, 5, 0, 2, 3, 3 |
.06 |
1, 1 |
| |
3933 K |
.54 |
13, 1, 7, 1, 10 |
.52 |
3, 5, 3 |
| |
3933 |
.37 |
8, 7, 7, 5, 8, 8, 0, 10 |
.35 |
3, 2 |
| MC 21645 |
4877 |
.32 |
15, 15 |
.47 |
|
| δ Cassiopeiae |
4872 |
.42 |
|
.42 |
|
| |
4866 |
.72 |
2, 3 |
|
|
| |
4861 Hβ |
1.49 |
7, 7, 23, 7 |
|
|
| |
4856 |
.72 |
17, 18 |
.90 |
|
| |
4851 |
.34 |
9, 7, 16 |
.50 |
|
| |
4846 |
.13 |
1, 3, 4 |
.17 |
|
| |
|
|
|
|
|
| |
4354 |
.31 |
4, 14, 16, 6, 6, 9, 9, 4 |
.31 |
16, 6, 9 |
| |
4349 |
.45 |
5, 13, 12, 7, 5, 5, 23 |
.45 |
13, 7, 5 |
| |
4345 |
.81 |
1, 1, 24, 6, 11, 16, 21 |
.75 |
5, 0, 5 |
| 480 |
4340 Hγ |
1.46 |
4, 9, 4, 9, 16 |
|
|
| |
4336 |
.84 |
33, 18, 9, 14, 9, 19 |
.86 |
16, 16 |
| |
4331 |
.55 |
20, 18, 5, 7, 5, 5, 3 |
.50 |
13, 12, 0 |
| |
4327 |
.32 |
20, 15, 2, 13, 3, 0, 17 |
.32 |
15, 13, 3 |
| |
|
|
|
|
|
| |
4112 |
.34 |
2, 4, 14, 8, 1, 1, 6, 1 |
.30 |
0, 10, 5, 5 |
| |
4109 |
.54 |
4, 12, 22, 21, 4, 11, 13 |
.47 |
5, 15, 3, 18 |
| |
4105 |
.88 |
2, 8, 18, 13, 34, 17, 13, 3 |
.75 |
5, 5, 0 |
| |
4102 Hδ |
1.54 |
1, 6, 4, 1, 4 |
|
|
| |
4098 |
.86 |
4, 6, 11, 29, 11, 19, 26 |
.74 |
6, 1, 1, 7 |
| |
4095 |
.53 |
13, 8, 8, 22, 3, 3, 14 |
.47 |
2, 2, 3, 3 |
| |
4091 |
.33 |
11, 8, 8, 17, 9, 8, 9 |
.29 |
4, 4, 13, 4 |
| |
|
|
|
|
|
| |
3976 |
.84 |
9, 4, 29, 7, 56, 17, 9, |
|
|
| |
|
|
21 |
.68 |
13, 9, 1, 7 |
| |
3973 |
1.37 |
7, 23, 32, 13, 1 |
1.27 |
22, 23 |
| |
3970 Hε |
2.15 |
5, 15, 5, 10, 12 |
|
|
| |
|
|
|
|
|
| |
3933 K |
1.48 |
23, 3, 2, 22, 2 |
|
|
| MC 21646 |
4861 Hβ |
.25 |
|
.25 |
|
| α Cassiopeiae |
4444 Ti+ |
.31 |
6, 6 |
.31 |
6, 6 |
| |
4340 Hγ |
.42 |
5, 5 |
.42 |
5, 5 |
| |
4227 Ca |
.83 |
2, 1 |
.83 |
2, 1 |
| |
4215 Sr+ |
.71 |
1, 1 |
.71 |
1, 1 |
| |
4101 Hδ |
.56 |
11, 11 |
.56 |
11, 11 |
| |
3970 Hε |
2.50 |
5, 5 |
2.50 |
5, 5 |
| |
3933 K |
2.47 |
|
2.47 |
|
| MC 21721 |
4861 Hβ |
.43 |
16, 11, 4, 32, 11, 4 |
|
|
| |
|
|
|
|
|
| α Aurigae |
4444 Ti+ |
.21 |
9, 14, 1, 11, 4, 11, 1 |
|
|
| |
|
|
|
|
|
| |
4340 Hγ |
.74 |
21, 11, 1, 7, 9, 4, 12 |
|
|
| |
|
|
|
|
|
| |
4326 Fe |
.62 |
13, 5, 10, 13, 5, 17 |
|
|
| |
|
|
|
|
|
| |
4227 Ca |
.57 |
30, 37, 5, 7, 8 |
|
|
| |
|
|
|
|
|
| |
4215 Sr+ |
.36 |
14, 11, 1, 4, 6 |
|
|
| |
|
|
|
|
|
| |
4101 Hδ |
.57 |
0, 12, 10, 13, 2, 5, 17 |
|
|
| |
|
|
|
|
|
| |
3976 |
.53 |
2, 1 |
|
|
| |
3973 |
1.14 |
8, 7 |
|
|
| |
3970 Hε |
1.62 |
13, 5, 17, 23, 22 |
|
|
| |
3967 |
1.13 |
17, 16 |
|
|
| |
3964 |
.62 |
|
|
|
| 481 |
3939 |
.80 |
0, 5, 5 |
|
|
| |
3936 |
1.27 |
10, 10 |
|
|
| |
3933 K |
1.67 |
5, 3, 10, 0, 5 |
|
|
| |
3930 |
1.27 |
10, 10 |
|
|
| |
3927 |
.76 |
4, 6, 1 |
|
|
| MC 21722 |
4866 |
.32 |
5, 0, 10, 5 |
|
|
| δ Canis |
4861 Hβ |
.61 |
1, 4, 4 |
|
|
| Majoris |
4856 |
.28 |
4, 1, 6, 2 |
|
|
| |
|
|
|
|
|
| |
4444 Ti+ |
.76 |
4, 4, 6 |
|
|
| |
|
|
|
|
|
| |
4345 |
1.12 |
7, 8 |
|
|
| |
4340 Hγ |
1.12 |
|
|
|
| |
4336 |
1.21 |
9, 9 |
|
|
| |
|
|
|
|
|
| |
4326 Fe |
.78 |
7, 8, 2 |
|
|
| |
|
|
|
|
|
| |
4227 Ca |
.70 |
10, 10 |
|
|
| |
|
|
|
|
|
| |
4215 Sr+ |
.51 |
1, 1 |
|
|
| |
|
|
|
|
|
| |
4105 |
.31 |
1, 1 |
|
|
| |
4101 Hδ |
.86 |
1, 1, 1 |
|
|
| |
4098 |
.21 |
6, 6 |
|
|
| |
|
|
|
|
|
| |
3970 Hε |
> 2.25 |
|
|
|
| |
|
|
|
|
|
| |
3933 K |
> 2.25 |
|
|
|
| MC 21788 |
4861 Hβ |
.22 |
0, 3, 3, 3, 3, 10 |
.25 |
0, 0, 0, 0 |
| ß Orionis |
4481 Mg+ |
.22 |
3, 3, 0, 8, 0, 12 |
.22 |
3, 0, 8, 0, 12 |
| |
4471 He |
.21 |
4, 4, 1, 9, 1, 11 |
.16 |
1, 6, 6 |
| |
4340 Hγ |
.45 |
20, 5, 5, 15, 5, 18 |
.36 |
4, 4, 9 |
| |
4101 Hδ |
.43 |
12, 3, 3, 12, 3, 13 |
.40 |
0, 0 |
| |
4026 He |
.14 |
3, 1, 2, 8, 2, 5 |
.12 |
0, 0 |
| |
3970 Hε |
.45 |
10, 5, 0, 7, 5, 18 |
.46 |
4, 1, 6, 6 |
| |
3933 K |
.17 |
2, 3, 3, 0, 2, 2 |
.18 |
2, 2, 1, 3 |
| |
3889 Hζ |
.43 |
12, 12, 8, 11, 8, 18 |
.54 |
1, 1, 2 |
| MC 21789 |
4861 Hβ |
.23 |
7, 3, 1, 3 |
.23 |
7, 3, 1, 3 |
| ε Orionis |
4471 He |
.31 |
16, 6, 1, 11 |
.20 |
|
| |
4387 He |
.24 |
2, 4, 8, 2 |
.20 |
|
| |
4340 Hγ |
.40 |
12, 8, 2, 5 |
.35 |
|
| |
4116 He |
.17 |
5, 2, 5, 2, 3 |
.17 |
2, 2, 3 |
| |
4101 Hδ |
.37 |
5, 5, 3, 2 |
.36 |
4, 4, 1 |
| |
4097 |
.17 |
5, 2, 2, 2 |
.15 |
0, 0, 0 |
| |
4026 He |
.19 |
1, 1, 1, 4 |
.17 |
3, 2 |
| 482 |
3970 Hε |
.32 |
8, 2, 5, 10 |
.30 |
7, 8 |
| |
3889 Hζ |
.33 |
2, 14, 6, 11 |
.33 |
2, 14, 6, 11 |
| MC 21803 |
4877 |
.12 |
3, 2, 2, 0, 2, 0 |
.11 |
1, 1, 1, 1, 1 |
| α Canis |
4872 |
.30 |
25, 8, 5, 0, 10, 5 |
.25 |
3, 0, 5, 5, 0 |
| Majoris |
4866 |
.56 |
11, 4, 4, 9, 6, 4 |
.55 |
3, 3, 10, 5 |
| |
4861 Hβ |
1.02 |
18, 7, 2, 10 |
.96 |
1, 4, 4 |
| |
4856 |
.67 |
13, 12, 0, 13, 12, 0 |
.65 |
10, 2, 15, 10, 12 |
| |
4851 |
.31 |
11, 4, 4, 1, 4, 1 |
.29 |
2, 2, 3, 2, 3 |
| |
4846 |
.13 |
9, 1, 3, 3, 2, 1, 3 |
.12 |
0, 2, 2, 3, 0, 2 |
| |
|
|
|
|
|
| |
4481 Mg+ |
.20 |
5, 0, 0, 0, 0, 8 |
.18 |
2, 2, 2, 2, 6 |
| |
|
|
|
|
|
| |
4354 |
.28 |
2, 6, 7, 6, 1, 4 |
.31 |
4, 4, 1 |
| |
4349 |
.45 |
5, 3, 2, 3, 3, 2 |
.45 |
2, 3, 2 |
| |
4345 |
.80 |
10, 5, 0, 5, 2 |
.79 |
1, 4, 3 |
| |
4340 Hγ |
1.38 |
7, 8, 7, 6 |
1.39 |
6, 7 |
| |
4336 |
.83 |
1, 4, 6, 3, 2, 2 |
.82 |
5, 3, 3 |
| |
4331 |
.43 |
3, 1, 4, 8, 4, 2 |
.46 |
1, 1, 1 |
| |
4327 |
.27 |
3, 5, 3, 0, 0, 0 |
.28 |
2, 1, 1 |
| |
|
|
|
|
|
| |
4125 |
.12 |
10, 7, 5, 2, 2, 3 |
.11 |
4, 1, 4 |
| |
4121 |
.20 |
15, 5, 5, 3, 5, 2 |
.17 |
2, 2, 4 |
| |
4116 |
.42 |
15, 7, 10, 0, 10, 10 |
.39 |
7, 7, 13 |
| |
4112 |
.60 |
15, 5, 8, 15, 8, 8 |
.52 |
0, 0, 0 |
| |
4109 |
.98 |
17, 16, 4, 6 |
.97 |
5, 5 |
| |
4102 Hδ |
1.45 |
12, 13, 17, 15 |
1.46 |
16, 16 |
| |
4098 |
1.04 |
21, 9, 2, 12 |
.97 |
5, 5 |
| |
4095 |
.61 |
29, 6, 9, 9, 6 |
.53 |
1, 1, 2 |
| |
4091 |
.43 |
14, 3, 16, 4, 11, 9 |
.37 |
10, 5, 15 |
| |
4088 |
.24 |
11, 2, 7, 1, 4, 2 |
.20 |
3, 0, 2 |
| |
4084 |
.12 |
10, 0, 7, 0, 7, 3 |
.08 |
3, 3, 7 |
| |
|
|
|
|
|
| |
3986 |
.12 |
7, 0, 12, 5, 10, 2, 0 |
.12 |
0, 12, 5, 10, 2, 0 |
| |
|
|
|
|
|
| |
3983 |
.25 |
7, 2, 7, 7, 0, 2 |
.25 |
2, 7, 7, 0, 2 |
| |
3980 |
.42 |
15, 2, 10, 12, 0, 7 |
.42 |
2, 10, 12, 0 |
| |
3976 |
.66 |
22, 2, 5, 0, 18 |
.58 |
5, 2, 7, 10 |
| |
3973 |
.86 |
22, 13, 8 |
.97 |
3, 2 |
| |
3970 Hε |
1.47 |
11, 11, 18, 11 |
1.45 |
11, 20, 9 |
| |
3967 |
1.10 |
20, 8, 2, 15 |
1.02 |
0, 10, 7 |
| |
3964 |
.70 |
27, 3, 10, 5, 15 |
.64 |
5, 2, 3, 7 |
| |
3960 |
.47 |
23, 2, 5, 3, 7, 10 |
.43 |
2, 1, 7, 3, 6 |
| |
3957 |
.33 |
24, 0, 6, 0, 8, 8 |
.28 |
5, 1, 5, 3, 3 |
| |
3954 |
.23 |
19, 4, 6, 13, 11 |
.16 |
11, 1, 6, 4 |
| |
|
|
|
|
|
| |
3933 K |
.18 |
12, 2, 6, 4, 3, 6 |
.17 |
3, 5, 5, 2 |
| |
|
|
|
|
|
| |
3889 Hζ |
1.48 |
7, 9, 17, 16 |
1.55 |
|
4839. Table X contains a summary of the results, for line centers only.
Successive columns give the name of the star, the spectral class, the
absolute magnitude, and the drop in magnitudes from background to
line center, for the spectrum lines mentioned at the heads of the
columns. The greater line depth for absolutely brighter stars, at
least among those of the second type, is especially to be noted.
| TABLE X |
|---|
| Drop in Intensity, from Background to Line Center, for Eleven Stars, expressed in Stellar Magnitudes |
|---|
| Star |
Class |
M |
Hβ |
Hγ |
Hδ |
Hε |
K |
4227 |
4215 |
| ε Ori |
B0 |
|
.23 |
.40 |
.37 |
.32 |
|
|
|
| ß Ori |
cB8 |
5: |
.22 |
.45 |
.43 |
.46 |
.17 |
|
|
| α Lyr |
A0 |
0.6 |
.95 |
1.43 |
1.60 |
1.68 |
.23 |
|
|
| α CMa |
A0 |
1.2 |
.96 |
1.39 |
1.46 |
1.47 |
|
|
|
| α Cyg |
cA2 |
4: |
.33 |
.63 |
.63 |
.70 |
.54 |
|
|
| α Aql |
A5 |
2.4 |
.71 |
.81 |
.71 |
1.50 |
.79 |
|
|
| δ Cas |
A5 |
1.6 |
1.49 |
1.46 |
1.54 |
2.15 |
1.48 |
|
|
| δ CMa |
cF8 |
3: |
.61 |
1.12 |
.86 |
>2.25 |
>2.25 |
.70 |
.51 |
| α Aur |
G0 |
0.0 |
.43 |
.76 |
.57 |
1.62 |
1.67 |
.57 |
.36 |
| α Boo |
K0 |
0.3 |
|
.54 |
.74 |
|
|
1.34 |
.70 |
| α Cas |
K0 |
0.0 |
.25 |
.42 |
.56 |
2.50 |
2.47 |
.83 |
.71 |
10. The material contained in Table X is reproduced in Table XI,
where the intensity at the line center is expressed in terms of percentage
of the background intensity, instead of in stellar magnitudes.
The “background intensity,” as defined in Section 6, is the intensity
that the background would have if the line were not present. It is
noteworthy that, for the great majority of the lines, the residual intensity
at the line center is greater than 30 per cent of the background
intensity.
11. The material presented above constitutes the first systematic
study of the contours of strong absorption lines. In view of the preliminary
nature of the work the discussion has been devoted for the
most part to presentation of method. Extended discussion seems at
present to be premature, and only a few points need be mentioned.
Probably the chief interest of Table X lies in the result that the
maximum intensity drop from background to line recorded for any
of these stars is 2.50 magnitudes, corresponding to a light loss of
484ninety per cent. Except for the supergiant cF8 star and the Ca+
absorption for α Cassiopeiae and Hε for δ Cassiopeiae, the light remaining
at the center of the line is at least fifteen per cent of the background
intensity. On the average for all these strong absorption
lines there is something like twenty-five per cent of the background
light remaining at the center of the lines. The significance of these
residual intensities will be discussed in a later publication, when the
forms of the lines as shown by the data of Table IX will also be considered.
| TABLE XI |
|---|
| Residual Intensities at Line Centers, expressed as percentages of Background Intensity |
|---|
| Star |
Class |
Hβ |
Hγ |
Hδ |
Hε |
K |
4227 |
4215 |
| ε Ori |
B0 |
81 |
69 |
71 |
74 |
|
|
|
| β Ori |
cB8 |
82 |
66 |
67 |
65 |
86 |
|
|
| α Lyr |
A0 |
42 |
27 |
23 |
21 |
81 |
|
|
| α CMa |
A0 |
41 |
28 |
26 |
26 |
|
|
|
| α Cyg |
cA2 |
74 |
56 |
56 |
52 |
61 |
|
|
| α Aql |
A5 |
51 |
47 |
51 |
25 |
48 |
|
|
| δ Cas |
A5 |
25 |
26 |
24 |
14 |
26 |
|
|
| δ CMa |
cF8 |
57 |
36 |
45 |
<13 |
<13 |
52 |
63 |
| α Aur |
G0 |
67 |
50 |
59 |
22 |
21 |
59 |
72 |
| α Boo |
K0 |
|
61 |
51 |
|
|
29 |
52 |
| α Cas |
K0 |
79 |
68 |
60 |
10 |
10 |
47 |
52 |
For the wider lines, especially those that are strong and heavily
winged, the intensities derived in this paper are probably of the right
order. Probably, however, the dispersion used is too small to reproduce
satisfactorily the detail at the centers of lines as narrow as
those of such stars as α Cygni and β Orionis. The difficulty introduced
does not involve inaccuracy of plates, microphotometer, or
process of measurement; it is concerned solely with the fact that the
spectral region examined is so narrow that, with the dispersion used,
the grain of the plate is not fine enough to reproduce the spectral
detail. The same difficulty would prevent any recognition of the
double reversal of the solar H and K lines, if they were studied with
the present dispersion.
Whatever the dispersion used, the same qualification must be made
in discussing the results; probably the dispersion would have to be
485greatly increased before the measured effective line depth becomes
much greater for narrow line stars.
Relative effective line depth, derived from numerous spectra made
with the same dispersion, is still, however, of considerable significance.
It permits us to recognize differences of surface gravity, and to form
an idea of relative chromospheric depths for different classes of stars.
Summary
1. The investigation deals with the determination of the depth and
contour of prominent absorption lines in the spectra of stars of various
classes.
2. The spectra used were made with the 16-inch refractor of the
Harvard Observatory, using two prisms and a special set of apertures.
3. Results are presented for eleven stars, of spectral class ranging
from B0 to K0.
4. The spectra were analyzed under uniform conditions by means
of the Moll thermoelectric microphotometer. The resolving power
of this instrument is such that no integrating effect need be considered
in discussing the results.
5. The microphotometer tracings were measured with reference
to fiducial lines representing “darkness” and “clear film,” and to a
line, representing the continuous background, drawn across the absorption
lines.
6. The intensity drop from continuous background to line was
deduced graphically from the measures.
7. The accuracy of the results is discussed in detail.
a. The reliability of the plates, as judged from qualitative
reproduction of detail, and from the consistency of the numerical
results, is satisfactory. Effects of stray light are of negligible
magnitude, and in this respect slit spectra appear to have no
advantage over objective prism spectra.
b. Effects of poor focus are measurable, but small. Spectra
that are in such poor focus as to cause appreciable inaccuracy
would be rejected from visual inspection.
c. The accuracy of the microphotometer tracings is in general
satisfactory. Tracings showing abnormal deflections from “darkness”
to “clear film” are not susceptible of correction, and are
omitted in deriving results.
d. The measures upon the tracings are also of satisfactory
accuracy.
4868. The differences in intensity between the continuous background
and various points along the line contour are tabulated for the eleven
stars under discussion.
9. The general results for the intensities at the centers of lines show
an interesting relation to absolute brightness; the brighter stars have,
in general, lines that cut more deeply into the background. A result
of considerable interest is that the average residual intensity in the
strong wide absorption lines is more than 30 per cent of the background
intensity.
- 1.
- Daly, Reginald A.—The Geology of Ascension Island. pp. 1–80. 21
pls. June, 1925. $3.00.
- 2.
- Barnett, S. J., and Barnett, L. J. H.—New Researches on the
Magnetization of Ferromagnetic Substances by Rotation and the Nature of the Elementary
Magnet. pp. 125–216. July, 1925. $1.50.
- 3.
- Baxter, G. P., and Cooper, W. C., Jr.—A Revision of the Atomic
Weight of Germanium. II The Analysis of Germanium Tetrabromide. pp. 219–237. October,
1925. $0.75.
- 4.
- Dana, L. I.—The Latent Heat of Vaporization of Liquid
Oxygen-Nitrogen Mixtures. pp. 241–267. October, 1925. $0.75.
- 5.
- Pierce, George W.—Piezoelectric Crystal Oscillators Applied to
the Precision Measurement of the Velocity of Sound in Air and CO2 at High Frequencies.
pp. 271–302. October, 1925. $0.75.
- 6.
- Bridgman, P. W.—Certain Physical Properties of Single Crystals of
Tungsten, Antimony, Bismuth, Tellurium, Cadmium, Zinc, and Tin. pp. 305–383. October,
1925. $2.50, with 7 and 8.
- 7.
- Bridgman, P. W.—Various Physical Properties of Rubidium and
Caesium and the Resistance of Potassium Under Pressure. pp. 385–421. October, 1925.
$2.50, with 6 and 8.
- 8.
- Bridgman, P. W.—The Effect of Tension on the Transverse and
Longitudinal Resistance of Metals. pp. 423–449. October, 1925. $2.50, with 6 and 7.
- 9.
- Boschma, H.—On the Symbiosis or Certain Bermuda Coelenterates and
Zooxanthellae. pp. 451–460. October. 1925. $0.50.
- 10.
- Kennelly, A. E., and Slepian, Arthur.—Computation of the Behavior
of Electric Filters Under Load. pp. 461–483. October, 1925. $0.75.
- 11.
- Franklin, Wm. S.—Indeterminism in the Physical World. pp.
485–502. November, 1925. $0.50.
- 12.
- Yeh, Chi-Sun.—The Effect of Hydrostatic Pressure on the Magnetic
Permeability of Iron, Cobalt, and Nickel. pp. 503–535. December, 1925. $0.50.
- 13.
- Roebuck, J. R.—The Joule-Thomson Effect in Air. pp. 537–596.
December 1925. $0.75.
- 14.
- Records of Meetings; Biographical Notices; Officers and
Committees; List of Fellows and Foreign Honorary Members; Statutes and Standing Votes.
etc. pp. 597–710. December, 1925. $0.50.
- 1.
- Lewis, Frederic T.—A Further Study of the Polyhedral Shapes of
Cells. pp. 1–35. December, 1925. $0.50.
- 2.
- Heidel, W. A.—The Calendar of Ancient Israel. pp. 37–56.
December, 1925. $0.50.
- 3.
- Bridgman, P. W.—The Effect of Pressure on the Viscosity of
Forty-three Pure Liquids. February, 1926. pp. 57–99. $0.75.
- 4.
- Bridgman, P. W.—Thermal Conductivity and Thermal E.M.F. of Single
Crystals of Several Non-cubic Metals. pp. 101–134. February, 1926. $0.75.
- 5.
- Slater, J. C.—Measurements of the Compressibility of the Alkali
Halides. pp. 135–150. April, 1926. $0.50.
- 6.
- Palache, Charles.—Contributions to Mineralogy from the Department
of Mineralogy and Petrography, Harvard University. 12. Catalogue of the Collection of
Meteorites in the Mineralogical Museum of Harvard University. pp. 151–159. May, 1926.
$0.25.
- 7.
- Rogers, Austin F.—A Mathematical Study of Crystal Symmetry. pp.
161–203. June, 1926. $0.75.
- 8.
- Brues, Charles T.—Studies on Ethiopian Braconidæ, with a
Catalogue of the African Species. pp. 205–436. June, 1926. $2.50.
- 9.
- Davis, Tenney L., and Abrams, Armand J. J.—Studies in the Urea
Series. pp. 437–457. June, 1926. $0.50.
- 10.
- Payne, Cecilia H., and Shapley, Harlow.—On the Distribution of
Intensity in Stellar Absorption Lines, pp. 459–486. June, 1926. $0.50.
PUBLICATIONS
OF THE
AMERICAN ACADEMY OF ARTS AND SCIENCES.
MEMOIRS. Old Series, Vols. 1–4; New Series, Vols. 1–14.
16 volumes, $10 each. Half volumes, $5 each. Discount to
booksellers and Libraries 25%; to Fellows 50%, or for whole
sets 60%.
- Vol. 13. 1.
- Curtiss, D. R.—Binary Families in a Triply connected Region with Especial Reference to
Hypergeometric Families. pp. 1–60. January, 1904. $1.00.
- 2.
- Tonks, O. S.—Brygos: his Characteristics, pp. 61–119. 2 pls. November, 1904. $1.50.
- 3.
- Lyman. T.—The Spectrum of Hydrogen in the Region of Extremely Short Wave-Length, pp.
121–148. pls. iii-viii. February, 1906. 75c.
- 4.
- Pickering, W. H.—Lunar and Hawaiian Physical Features Compared, pp. 149–179. pls.
ix-xxiv. November, 1906. $1.10.
- 5.
- Trowbridge, J.—High Electro-motive Force, pp. 181–215 pls. xxv-xxvii. May, 1907. 75c.
- 6.
- Thaxter. R.—Contribution toward a Monograph of the Laboulbeniaceæ. Part II. pp. 217–469.
pls. xxviii-lxxi. June, 1908. $7.00.
- Vol. 14. 1.
- Lowell, Percival.—The Origin of the Planets, pp. 1–16. pls. i-iv. June, 1913. 60c.
- 2.
- Fernald, W. E., Southard, E. E., and Taft, A. E.—Waverley Researches In the Pathology of
the Feeble-Minded. (Research Series, Cases I to X.) pp 17–128. 20 pls. May, 1918. $6.00.
- 3.
- Fernald, W. E., Southard, E. E., Canavan, M. M., Raeder, O. J., and Taft, A. E.—Waverley
Researches In the Pathology of the Feeble-Minded. (Research Series, Cases XI to XX.) pp.
129–207. 32 pls. December, 1921. $6.50
- 4.
- Pickering, Edward C., Parkhurst, J. A., Aitken, Robert G., Curtis, Heber D., Mitchell, S.
A., Alden, Harold L., Simpson, T. McN., and Reed, F. W.—Photometric Magnitudes of Faint
Standard Stars, measured visually at Harvard, Yerkes, Lick and McCormick Observatories,
pp. 209–307. 9 pls. August, 1923. $6.00.
- 5.
- Thaxter, R.—Contribution towards a Monograph of the Laboulbeniaceæ. Part III. pp.
309–426. 12 pls. $6.00.
- Vol. 15. 1.
- Jeffrey, E. C.—The Origin and Organization of Coal. pp. 1–52. 13 pls. November 1924.
$3.00.
- 2.
- Mills, Hiram F.—Flow of Water In Pipes. (With a historical and personal note by John R.
Freeman and introductory outline by Karl R. Kennison). pp. 55–236. Portrait. 6 Figs.
November, 1924. $7.50
- 3.
- Fernald, M. L.—Persistence of Plants in Unglaciated Areas of Boreal America. pp. 237–342.
73 maps. June 1925. $5.00.
PROCEEDINGS. Vols. 1–60, $5 each. Discount to booksellers
and Libraries 25%; to Fellows 50%, or for whole sets 60%.
The individual articles may be obtained separately. A price list of recent
articles is printed on the inside pages of the cover of the Proceedings.
Complete Works of Count Rumford. 4 vols., $5.00 each.
Memoir of Sir Benjamin Thompson, Count Rumford, with Notices of
his Daughter. By George E. Ellis. $5.00.
Complete sets of the Life and Works of Rumford. 5 vols., $25.00;
to Fellows, $5.00.
For sale at the Library of The American Academy of Arts and Sciences, 28 Newbury Street, Boston, Massachusetts.
- Typos fixed; non-standard spelling and dialect retained.
- Used numbers for footnotes
*** END OF THE PROJECT GUTENBERG EBOOK 75914 ***